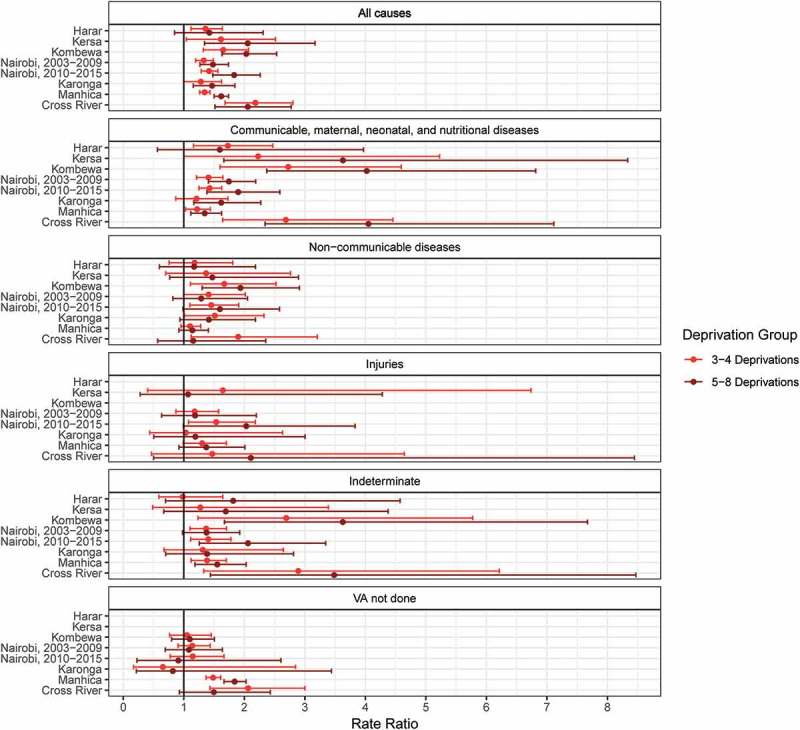
Figure 3.

Mortality rate ratios by level of deprivation for broad causes of death: higher deprivations compared to the fewest deprivations (0–2).
Note: Countries in which sites are located: Ethiopia (Harar, Kersa), Kenya (Kombewa, Nairobi), Malawi (Karonga), Mozambique (Manhiça), Nigeria (Cross River). Ratios estimated using negative binomial regressions, controlling for age, sex, and year. Kombewa and Harar HDSS deaths from injuries omitted from graph for scale (see appendix Table S7, Kombewa: 3–4 deprivation group: 8.3 [1.1–61.7], 5–8 deprivation group: 9.9 [1.3–72.5]; Harar: 3–4 deprivation group: 2.0 [1.0–4.1], 5–8 deprivation group: estimates unstable due to small number of deaths). Harar and Kersa HDSS deaths with no verbal autopsy omitted because almost every death had a verbal autopsy.
