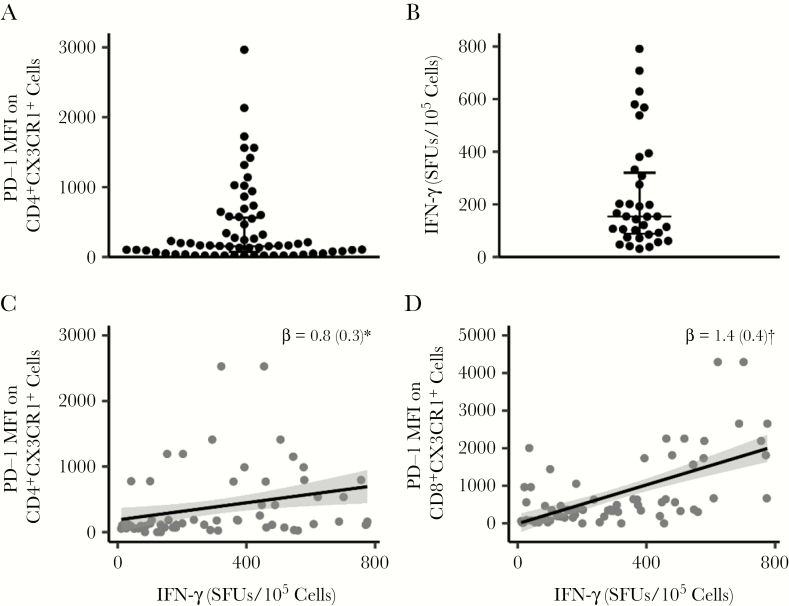
Figure 5.
PD-1 is associated with interferon (IFN) γ but not with CX3CR1+ memory cells or levels of cytomegalovirus (CMV) DNA. Peripheral blood mononuclear cells (PBMCs) from donors coinfected with human immunodeficiency virus and CMV (n = 40) and taking antiretroviral therapy (ART) were obtained >12 months apart (first sample obtained a median of 34 weeks after ART initiation). PBMCs from both time points (n = 80) were cultured with or without CMVpp65 (2 µg/mL) for 48 hours and then stained with antibodies against CD14, CD3, CD4, CD45RA, CX3CR1, and PD-1 and LIVE/DEAD fixable stain; expression of PD-1 (mean fluorescence intensity [MFI]) on live CD14−CD3+CD4+CD45RA−CX3CR1+ cells was then determined by means of flow cytometry. PD-1 MFI was calculated as value for control PBMC minus that for PBMC treated with CMVpp65. A, PD-1 MFI on CD4+CX3CR1+ memory cells. B, Frequency of IFN-γ–producing cells (determined in Figure 1) in donors with PD-1 MFI less than the median value; each dot in the plots represents an individual donor, and plots include observations from the 25th to 75th percentiles; horizontal lines represent median values. C, D, PD-1 MFI on CD4+ and CD8+ cells was correlated with the frequency of cells producing IFN-γ. Each black dot in the plots represents data from an individual donor. C–E, Gray dots represent means of measures from visits 1 and 2; black lines and gray shadowing, regression lines and their 95% confidence intervals, respectively. Note that dots are overlapping because some individuals have the same PD-1 values (0). Regression (β) coefficients are shown with standard error. *P < .05; †P < .01.

