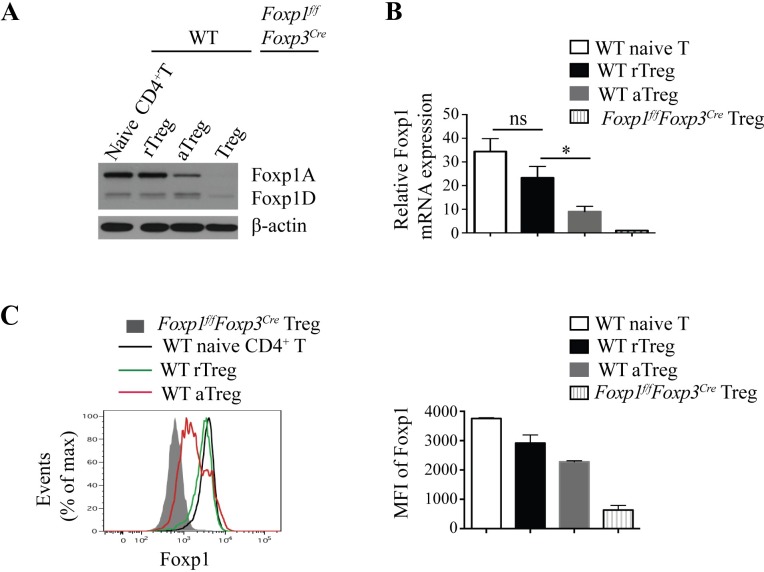
Fig 1. Foxp1 is differentially expressed in rTreg and aTreg cells.
(A) Immunoblot analysis of Foxp1 expression in sorted YFP−CD4+CD44lowCD62Lhigh naive CD4+ T cells (WT naive), YFP+CD4+CD44lowCD62Lhigh rTreg cells (WT rTreg), YFP+CD4+CD44highCD62Llow aTreg cells (WT aTreg) from Foxp3Cre mice, and YFP+ Treg cells from Foxp1f/fFoxp3Cre mice. (B) Relative Foxp1 mRNA expression in sorted WT naive CD4+ T cells, rTreg cells, aTreg cells from Foxp3Cre mice, and YFP+ Treg cells from Foxp1f/fFoxp3Cre mice, n = 3–4. (C) Intracellular staining of Foxp1 in splenic WT naive CD4+ T cells, rTreg cells, aTreg cells in Foxp3Cre mice and splenic Treg cells in Foxp1f/fFoxp3Cre mice (left panel), and the corresponding mean fluorescence intensity (MFI) of Foxp1 (right panel) (n = 2). Data in (A, C) represent at least two independent experiments. Data in (B) represent four independent experiments. Data in (B, C: right panel) are mean ± SEM. *P < 0.05 (two-tailed Student t test). Data associated with this figure can be found in the supplemental data file (S1 Data). aTreg, activated Treg; CD, cluster of differentiation; Foxp1, forkhead box P1; Foxp1A, Foxp1 isoform A; Foxp1D, Foxp1 isoform D; MFI, mean fluorescence intensity; rTreg, resting Treg; WT, wild-type; YFP, yellow fluorescent protein.

