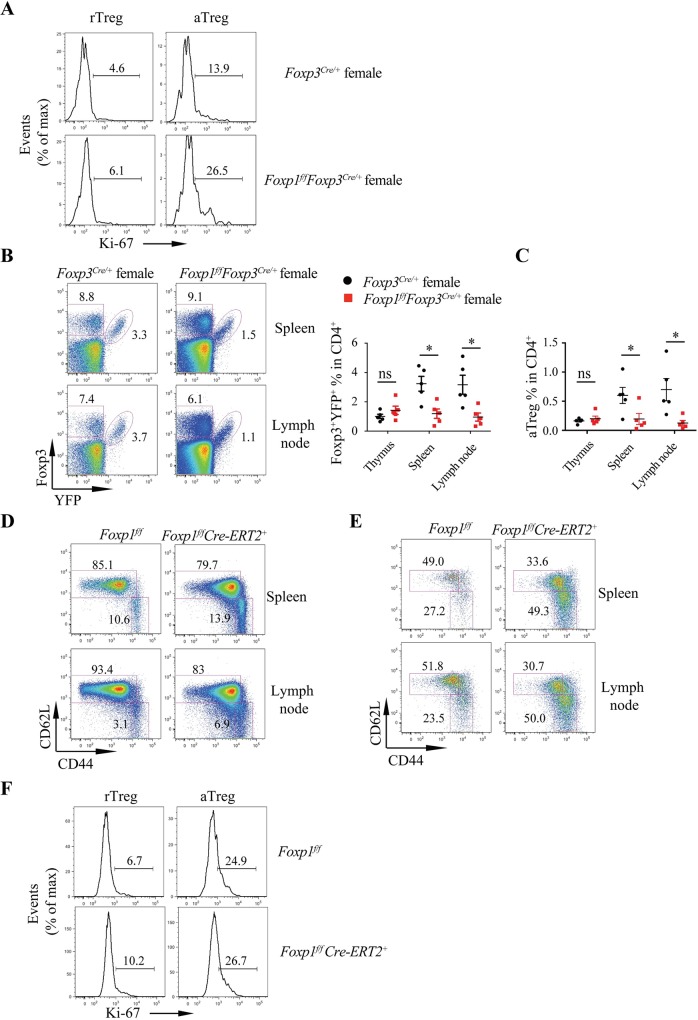
Fig 3. Foxp1 regulates rTreg cell quiescence in a cell-intrinsic manner.
(A) Flow cytometry analysis of Ki-67 expression in Foxp3+YFP+ rTreg and aTreg cells in the spleens from Foxp3Cre/+ and Foxp1f/fFoxp3Cre/+ female mice; numbers above bracketed lines indicate the percentages of Ki-67+ Treg cells. (B) Flow cytometry analysis of Foxp3+YFP+ Treg cells from spleens and lymph nodes of Foxp3Cre/+ and Foxp1f/fFoxp3Cre/+ female mice (left panel), and frequencies of Foxp3+YFP+ Treg cells (right panel) (n = 5). (C) Frequencies of Foxp3+YFP+ aTreg cells in CD4+ T cells, n = 5. (D-F) Foxp1f/f and Foxp1f/fCre-ERT2+ mice were treated with tamoxifen, and phenotypes were analyzed at d8 after treatment. (D) Flow cytometry analysis of CD44 and CD62L expression in CD4+Foxp3− conventional T cells from Foxp1f/f and Foxp1f/fCre-ERT2+ mice; numbers adjacent to the outlined areas indicate the percentages of naive cells (CD44lowCD62Lhigh) or activated cells (CD44highCD62Llow). (E) Flow cytometry analysis of CD44 and CD62L expression in Treg cells from Foxp1f/f and Foxp1f/fCre-ERT2+ mice; numbers adjacent to the outlined areas indicate the percentages of rTreg cells (CD44lowCD62Lhigh) or aTreg cells (CD44highCD62Llow). (F) Flow cytometry analysis of Ki-67 expression in rTreg and aTreg cells from Foxp1f/f and Foxp1f/fCre-ERT2+ mice. Numbers above bracketed lines indicate percentages of Ki-67+ Treg cells. Data in (A-F) are representative of at least two independent experiments. Data in (B: right panel, C) are mean ± SEM, *P < 0.05 (two-tailed Student t test). Data associated with this figure can be found in the supplemental data file (S1 Data). aTreg, activated Treg; CD, cluster of differentiation; d, day; Foxp1, forkhead box P1; Ki-67, antigen identified by monoclonal antibody Ki 67; ns, no significance; rTreg, resting Treg; Treg, regulatory T; YFP, yellow fluorescent protein.

