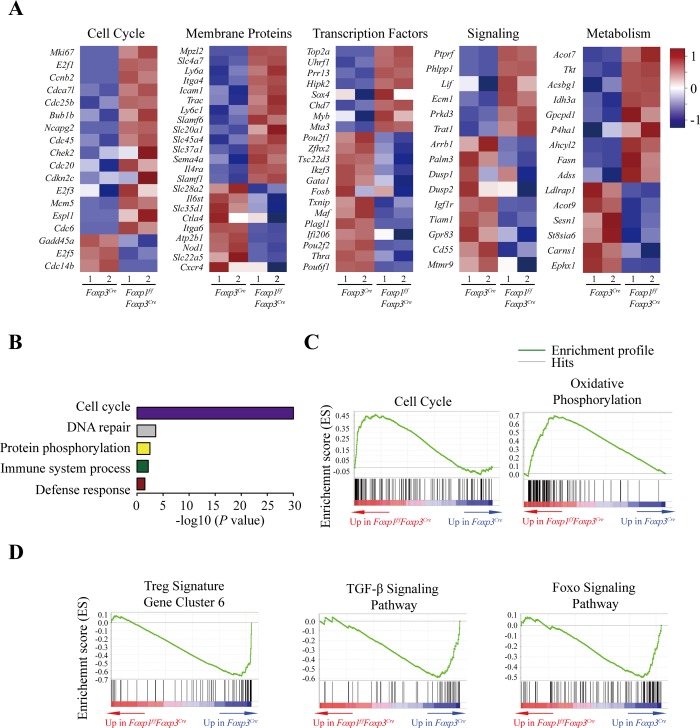
Fig 7. Foxp1-dependent transcriptional programs in Treg cells.
(A) Heatmap of the representative genes differentially expressed between highly purified Foxp3Cre and Foxp1f/fFoxp3Cre rTreg cells (fold change ≥1.5). (B) Enriched GO categories of the genes differentially expressed between Foxp3Cre and Foxp1f/fFoxp3Cre rTreg cells (Benjamin <0.05). (C) Enrichment of gene signatures related to cell cycle and oxidative phosphorylation in Foxp3Cre versus Foxp1f/fFoxp3Cre rTreg cells through gene set enrichment analysis (GSEA). Representative enriched gene sets are shown (FDR q value <0.05). (D) Enrichment of gene signatures related to Treg signature gene cluster 6, TGF-β signaling pathway, and Foxo signaling pathway in Foxp3Cre versus Foxp1f/fFoxp3Cre rTreg cells through GSEA. Representative enriched gene sets are shown (FDR q value <0.05). Two rounds of RNA sequencing were performed. Data associated with this figure can be found in the supplemental data file (S1 Data). FDR, false discovery rate; Foxo, forkhead box O; Foxp1, forkhead box P1; Foxp3, forkhead box P3; GO, Gene Ontology; GSEA, gene set enrichment analysis; rTreg, resting Treg; TGF-β, transforming growth factor, beta; Treg, regulatory T.

