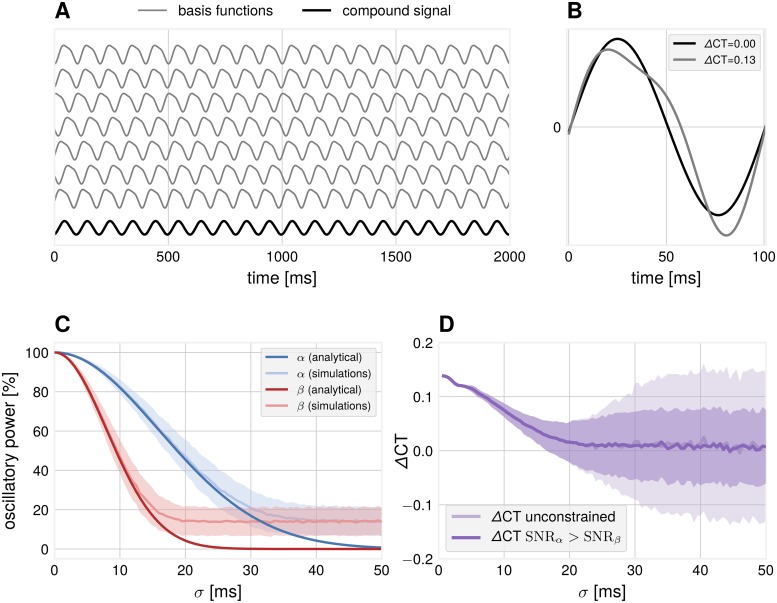
Fig 2. Simulation: Dependence of waveform measures on spatial mixing.
(A) Illustration how non-sinusoidal waveforms add up to a more sinusoidal compound signal if they are shifted with respect to each other with a certain standard deviation σ (example for σ = 30 ms). (B) Examples of one cycle of source and compound waveforms and their respective zero-crossings with associated ΔCT values. (C) The relative power of the two frequency components of the compound signal as evaluated from the Fourier spectrum. The β-component attenuates faster than the α-component. Number of iterations = 1000. Number of sources = 40. Error bars indicate ± 1 SD. In simulations, the obtained power for large temporal delays is constrained by the finite number of generators used and results in a deviation from the analytical solution. (D) ΔCT for the compound signal drops as a function of the standard deviation σ. In unconstrained simulations, SNRβ can get larger than SNRα, resulting in high values of ΔCT. Number of iterations = 1000. Error bars indicate ± 1 SD.

