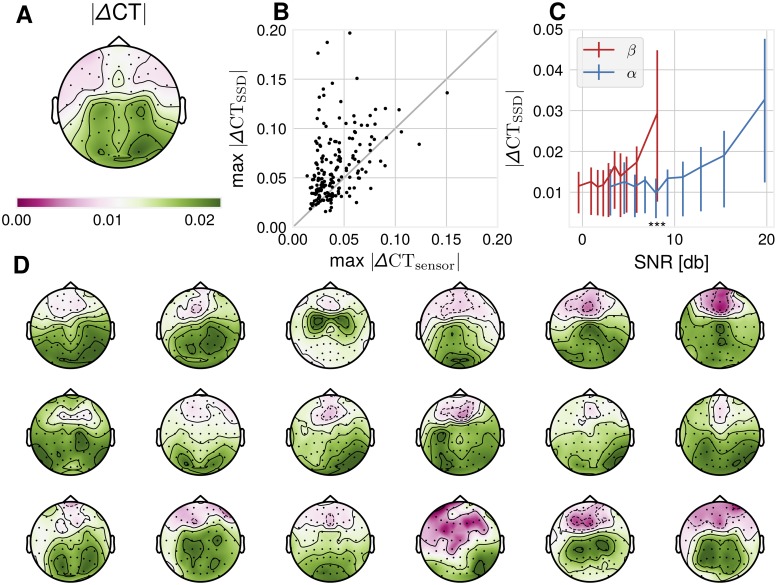
Fig 4. Data analysis: Empirical ΔCT-distributions.
(A) absolute ΔCT across participants computed from sensor space data, plotted topographically. (B) Maximal SSD absolute ΔCT is larger than sensor space absolute ΔCT across participants, N = 186, p = 5.7 ⋅ 10−15, two-sided Wilcoxon signed rank test. (C) Binned α-SNR and β-SNR as estimated from 1/f-adjusted spectrum versus mean absolute ΔCT in that bin. Error bars are 25th − 75th percentile value ranges for absolute ΔCT for the respective bin. Wilcoxon signed rank test between absolute ΔCT-values corresponding to the 10th bin of β-SNR and 5th bin of α-SNR: p-values: 5.40 ⋅ 10−18. (D) 18 single subject absolute ΔCT-topoplot examples show substantial variability of spatial ΔCT-distribution. Participants were selected according to the number of channels satisfying the SNR-criterion of 5 dB, so a topography is visible.

