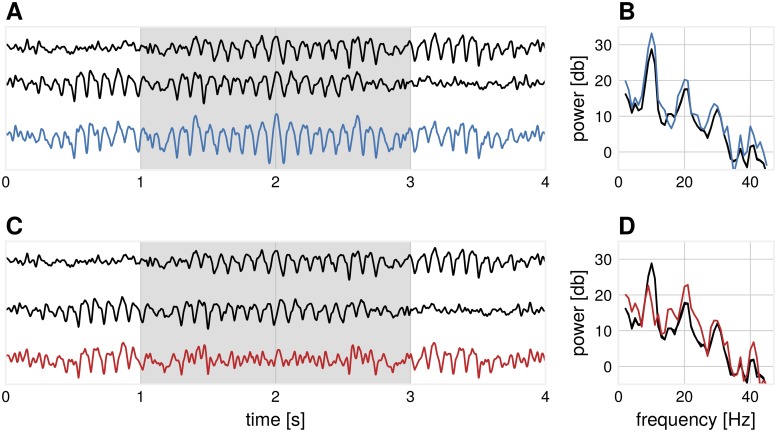
Fig 5. Illustration: The emergence of β-events from α-dominated sources.
(A) Two basis functions (black) mix with a temporal delay (σ = 15 ms) such that the α-power is enhanced in the compound signal (blue) during the segment marked in gray. (B) The corresponding power spectrum of the segment marked in gray for subplot (A) for basis functions (black) and compound signal, where both α- and β-spectral peaks are enhanced (blue). (C) Two basis functions (black) mix with a temporal delay (σ = 43 ms) such that the α-power is diminished in the compound signal (red) during the segment marked in gray. (D) The corresponding power spectrum of the segment marked in gray for subplot (C) for basis functions (black) and compound signal, where the α-peak is largely diminished and β-peak is enhanced (red).

