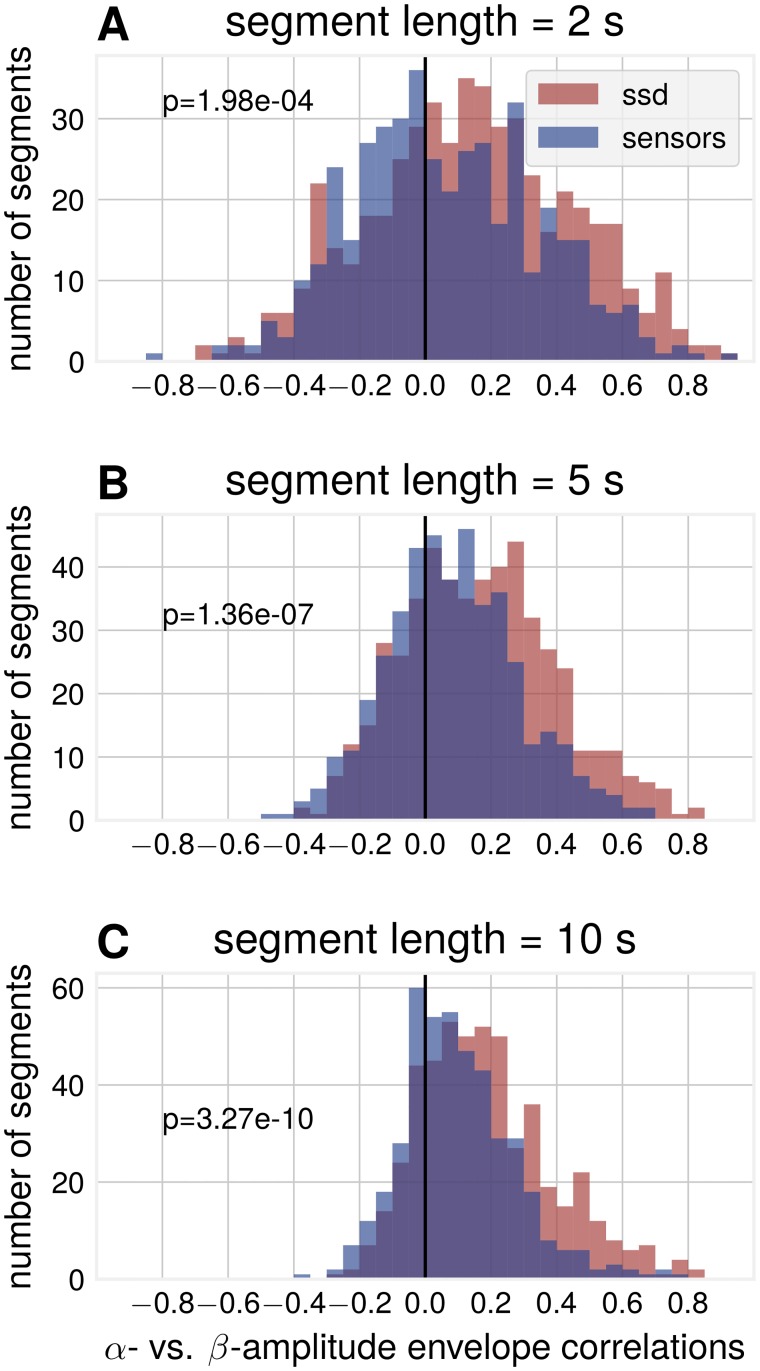
Fig 9. Data analysis: SSD components show increased correlations between α- and β-envelope time courses compared to sensor space.
Subplots are for different segment lengths, (A) 2 s (B) 5 s (C) 10 s. Three sensor space channels (C3, C4, Oz) and three SSD components for each participant, pooled over participants, p-values for Wilcoxon rank sum test (NSSD = 464, Nsensors = 374).

