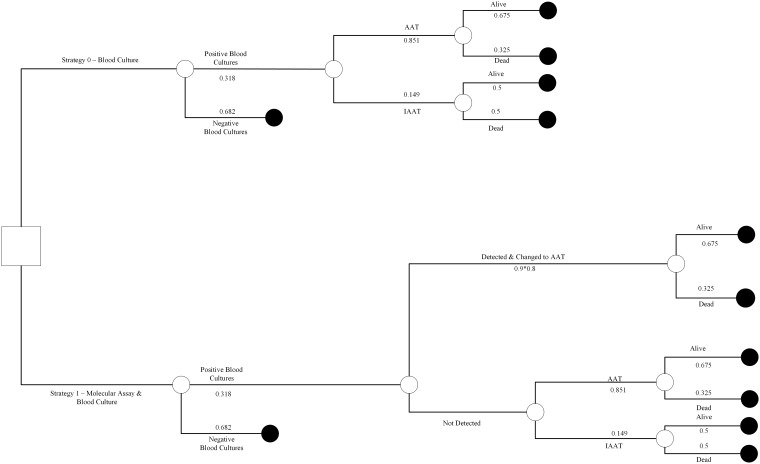
Fig 1. Decision tree with base case input values.
The decision tree is a graphical display of a logical sequence of events in the two study arms. The square represents the decision node from which the two competing strategies (molecular method plus blood cultures vs. blood cultures alone) originate. The circles are chance nodes that lead to a particular outcome (e.g. survival or death) beyond the control of our decision. The probabilities assigned to the decision tree are for baseline analysis and are listed in Table 1.

