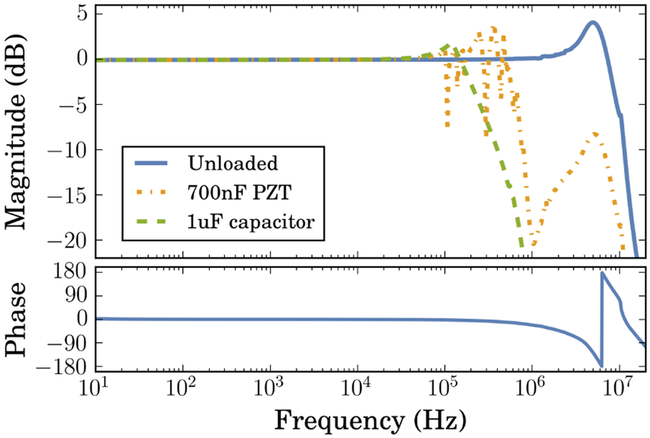
FIG. 7.
Modulation input transfer function (color online). The solid blue line indicates the unloaded frequency response, with the phase plotted in the lower panel. The dash-dotted orange trace shows the response with a 700 nF piezoelectric actuator (Thorlabs PN AE0505D08F). Several mechanical resonances above ≈ 50 kHz are clearly visible. The dashed green trace shows the response under a 1 μF capacitive load. Loaded response bandwidth is ≈ 100 kHz, and the unloaded gain is flat within 0.1 dB out to 1 MHz where the phase is −20°.

