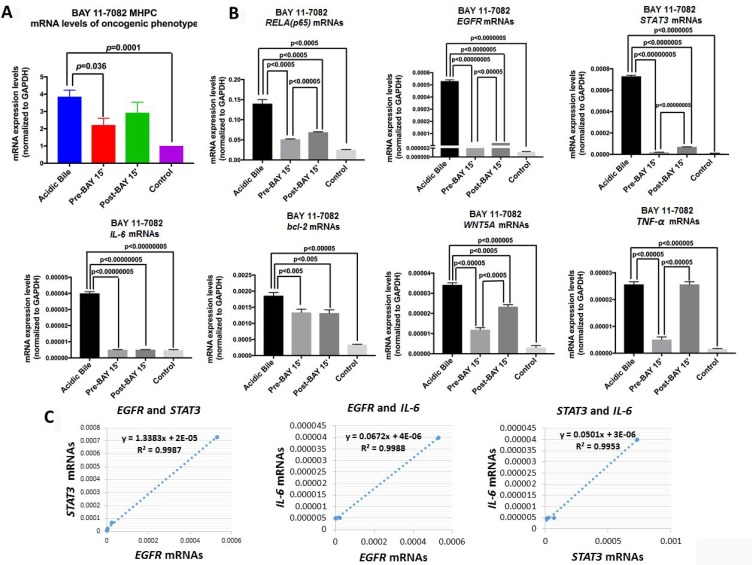
Figure 4. Pre- or post-application of BAY 11-7082 blocks the acidic bile-induced transcriptional activation of genes with oncogenic function in MHPC.
(A) Transcriptional levels of the analyzed NF-κB related genes with oncogenic function, are depicted in MHPC exposed to acidic bile alone and to (10 μM) BAY 11-7082 15 min before (Pre-BAY 15’) or after (Post-BAY 15’) acidic bile exposure, and controls. Graphs, created by GraphPad Prism 7 software (transcriptional levels of the analyzed genes are normalized to GAPDH by real time qPCR analysis). (ONE-WAY ANOVA, Freidman test). (B) Graphs represent transcriptional levels of each analyzed gene, RELA(p65), TNF-α, STAT3, IL-6, bcl-2, WNT5A, and EGFR (relative to GAPDH reference gene), in experimental and control-treated MHPC. The data are derived from real-time qPCR analysis. (Data are derived from three independent experiments. Graphs, created by GraphPad Prism 7 software; by t test; multiple comparisons by Holm-Sidak). (C) Diagrams show significant linear correlations by Pearson analysis, between EGFR and STAT3, EGFR and IL-6, and STAT3 and IL-6 mRNAs (by Pearson analysis, p value < 0.05).

