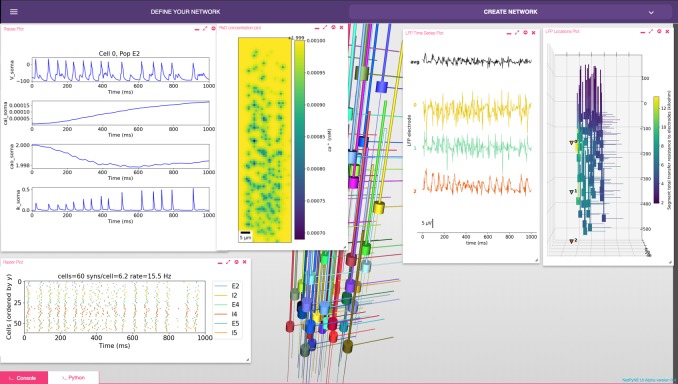
Figure 7. NetPyNE graphical user interface (GUI) showing a multiscale model.
Background shows 3D representation of example network with 6 populations of multi-channel, multi-compartment neurons; results panels from left to right: singe-neuron traces (voltage, intracellular and extracellular calcium concentration, and potassium current); spike raster plot; extracellular potassium concentration; LFP signals recorded from three electrodes; and 3D location of the LFP electrodes within network.

