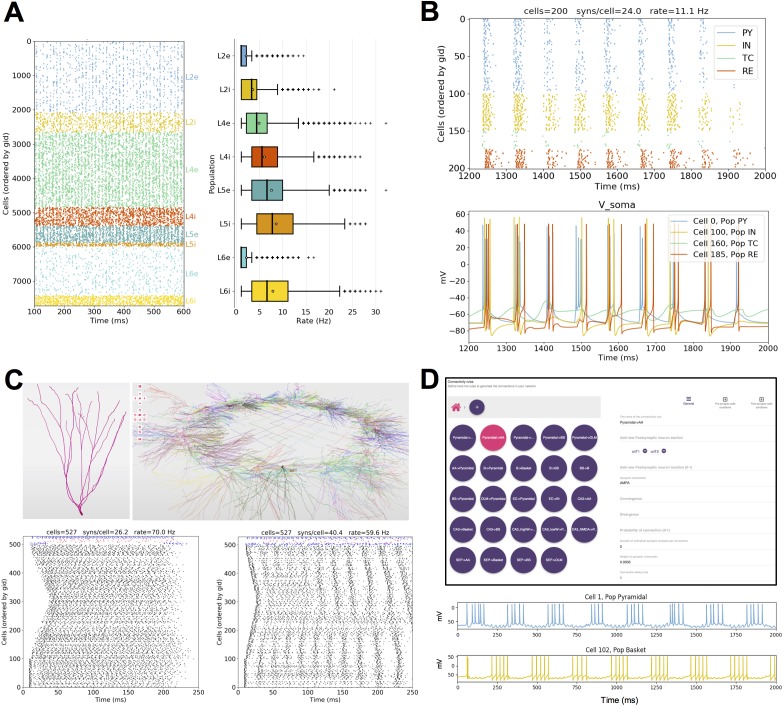
Figure 9. Published models converted to NetPyNE. .
All figures were generated using the NetPyNE version of the models. (A) Spike raster plot and boxplot statistics of the Potjans and Diesmann thalamocortical network originally implemented in NEST (Potjans and Diesmann, 2014; Romaro et al., 2018). (B) Spike raster plot and voltage traces of a thalamocortical network exhibiting epileptic activity originally implemented in NEURON/hoc (Knox et al., 2018). (C) 3D representation of the cell types and network topology, and spike raster plots of a dentate gyrus model originally implemented in NEURON/hoc (Rodriguez, 2018; Tejada et al., 2014). (D) Connectivity rules (top) and voltage traces of 2 cell types (bottom) in a hippocampal CA1 model originally implemented in NEURON/hoc (Cutsuridis et al., 2010; Tepper et al., 2018).

