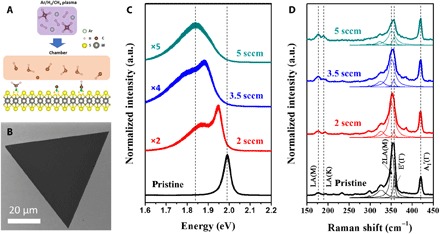
Fig. 1. Doping schematics and optical properties.

(A) Schematics of the plasma-assisted doping experiment. (B) SEM image of the carbon-doped monolayer WS2. (C) PL and (D) Raman spectra of the undoped and carbon-doped monolayered WS2 islands, with different methane flow rates during the plasma treatment (2, 3.5, and 5 sccm, respectively) obtained with a laser excitation of 488 and 514 nm, respectively. a.u., normalized Raman intensity shown in arbitrary units.
