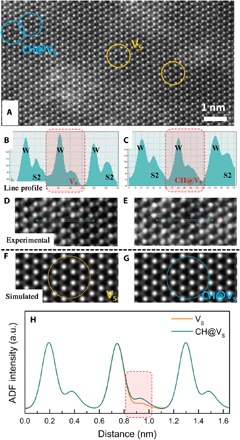
Fig. 3. TEM evidence of carbon doping in WS2.

Comparison between simulated and experimental HAADF-STEM images (the case of sulfur vacancies and a CH dopant occupying a sulfur vacancy) is shown. Experimental atomic-resolution HAADF-STEM image of the carbon-doped monolayer WS2 (A) shows an area with both sulfur vacancies (VS; yellow circles) and the CH dopant occupied sulfur monovacancies (CH@VS; blue circles) in the carbon-doped monolayer WS2. (B) and (D) show a sulfur monovacancy and its corresponding intensity line profiles, and (C) and (E) show the CH@VS and its corresponding intensity line profiles. (F and G) Simulated HAADF-STEM image of the carbon-doped monolayer WS2 with (F) VS and (G) a CH@VS in the hexagonal lattice. (H) Intensity line profile of the STEM image simulations with VS and CH@VS in the doped monolayer WS2.
