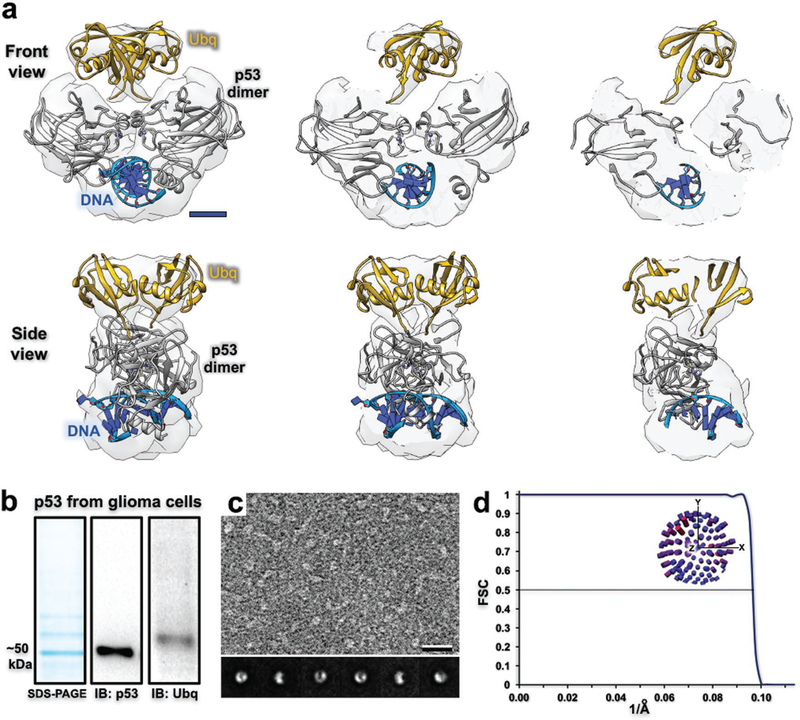
Figure 4.
Structural and biochemical analysis of p53 assembly isolated from human cancer cells. a) Cross sections through the 3D density map of the p53 dimer (gray structure; pdb code, 2A0C) isolated from GBM cells (U87MG line). The density located proximal to the dimer structure fits two ubiquitin monomers (yellow; pdb code, 1UBQ) and suggests a biologically relevant configuration to attach to each p53 subunit. Scale bar is 15 Å. b) p53 migrated to ≈50 kDa according to a denaturing gel and western blot analysis. Extra bands that migrated slower than ≈50 kDa appear to be ubiquitinated-p53 (Ubq) according to western blot detection. c) EM image of the p53 preparation. Corresponding class averages show consistent features and alternative views of the protein assembly. Scale bar is 100 Å; box size is 200 Å. d) According to the 0.5-FSC criteria, the ubiquitinated-p53 density map resolves to 10 Å and particles were not limited in their angular distribution (inset distribution plot).

