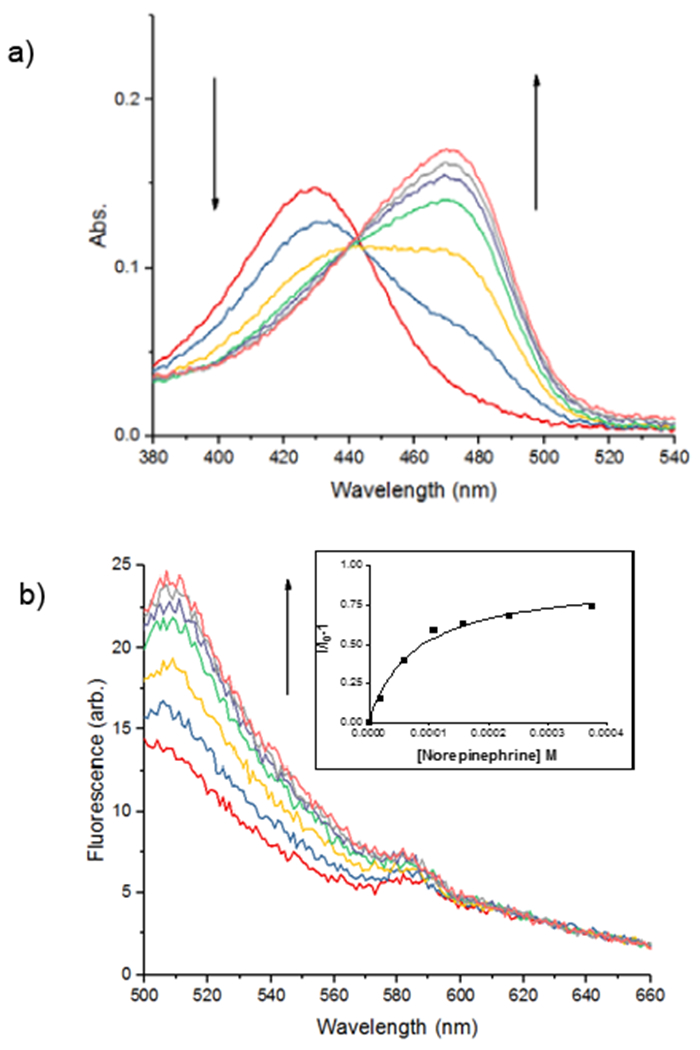
Figure 2.

(a) UV/vis titration and (b) fluorescence titration of the sensor NS510 (10 µM in 25 mM HEPES, 50 mM Na2S2O3, pH = 7.4) with norepinephrine (10 mM in buffer, λex = 488 nm). Inset in (b) is a plot of emission intensity at 510 nm versus concentration with a fit to a one-site binding isotherm.
