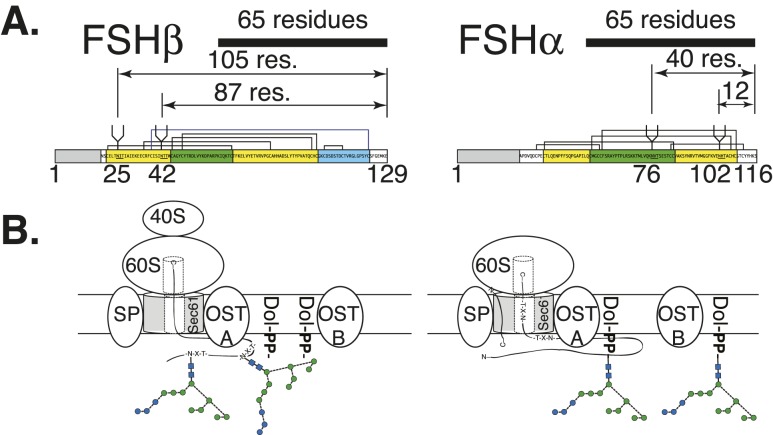
Figure 7.
Cotranslational and posttranslational glycosylation of FSH subunits. (A) Distance of subunit C terminus from N-glycosylation sites. The 65-residue bar indicates the distance from the ribosomal P site to the Asn residue of the FSH subunit sequon (90). Prepeptide numbering is used for each subunit diagram. (B) Potential cotranslational glycosylation of FSHβ and posttranslational glycosylation of FSHα. OSTA indicates isoform possessing STT3A associated with Sec61 translocon. OSTB indicates isoform possessing STT3B not associated with Sec61 translocon that can perform posttranslational N-glycosylation. For the oligosaccharide diagrams, the blue circles represent Glc residues, green circles represent mannose, and blue squares represent GlcNAc. Connecting lines show linkages as in Fig. 6 key.

