
Fig. 3.
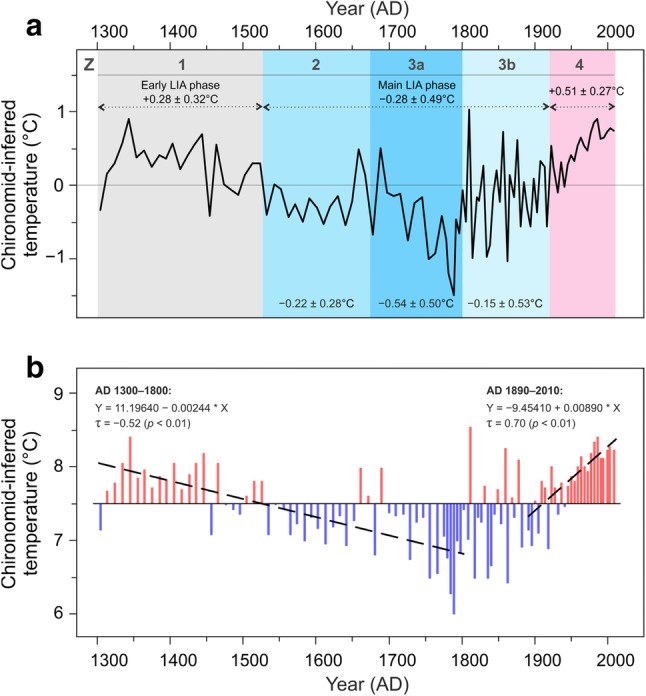
Chironomid-inferred mean July air temperature variability at MUT. a Temperature anomalies compared to the mean value over the entire record (7.5 °C). The numbers are the average temperature anomaly for time intervals corresponding to the zones (Z) and subzones established in the chironomid stratigraphy. b The linear decreasing (AD 1300–1800) and increasing (AD 1890–2010) trends of temperature values calculated by the Kendall-Theil robust line (dashed lines). The trend line equations with the median slope (°C/year) and intercept, the Mann–Kendall’s tau (τ) coefficient and the two-tailed p values are also shown