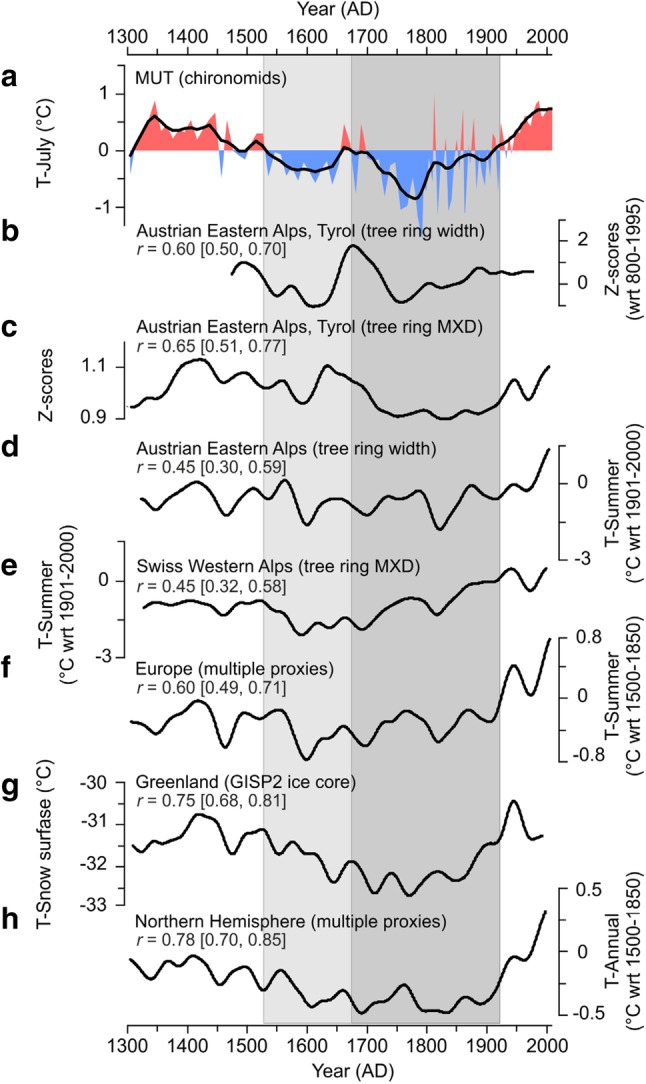
Fig. 4.

Temperature reconstructed in this study compared with other 30-years low-pass filtered paleotemperature records. a Chironomid-inferred mean July air temperature at MUT plotted along with the smoothed curve (thick line) centered to zero mean over the entire record, b tree-ring width (Nicolussi and Schiessling 2001; Osborn and Briffa 2006) and c maximum latewood density (MXD; Esper et al. 2007; Schneider et al. 2015) chronologies from Tyrol, Austria; mean summer air temperature inferences based on d tree-ring width chronologies from the Austrian Eastern Alps (Büntgen et al. 2011) and e tree-ring MXD chronologies from the Swiss Western Alps (Büntgen et al. 2006), f European mean summer temperature variability derived from tree-ring width/MXD and documentary records (Luterbacher et al. 2016), g average snow surface temperatures reconstructed from the GISP2 ice core near the Summit of the Greenland ice sheet (Kobashi et al. 2011), and h Northern Hemisphere mean annual air temperature reconstructed using multiple proxies (errors-in-variables approach; Shi et al. 2013). Pearson correlation coefficients (r) between chironomid-inferred mean July air temperature at MUT and other proxy-based temperature records (all after applying a 30-year Gaussian low-pass filter and linear detrending) are shown; the 95%-confidence intervals obtained by block bootstrap resampling are given in square brackets. The grey areas correspond to the colder periods identified in the MUT temperature reconstruction. wrt with regard to
