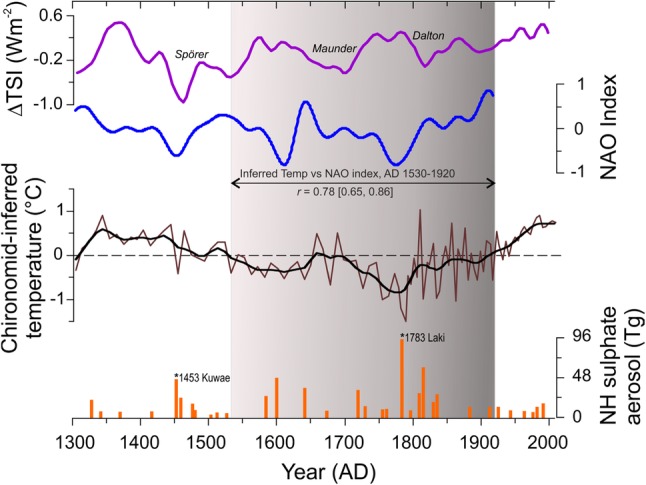
Fig. 5.

Temperature record from MUT compared with large-scale climate forcing processes such as variations in total solar irradiance (∆TSI, Steinhilber et al. 2009), the North Atlantic Oscillation (NAO index, 30-years low-pass filtered, Ortega et al. 2015), and the Northern Hemisphere (NH) stratospheric aerosol loading from explosive volcanic eruptions (Gao et al. 2008). Chironomid-inferred mean July air temperature for MUT is presented as original (thin line) and 30-years low-pass filtered (thick line) data and expressed as departures from the long-term average for the entire record. Pearson r calculated between chironomid-inferred mean July air temperature at MUT (Inferred Temp) and NAO index for the main LIA phase (AD 1530‒1920) after applying a 30-year Gaussian low-pass filter and linear detrending is shown; the 95%-confidence intervals obtained by block bootstrap resampling is given in square brackets
