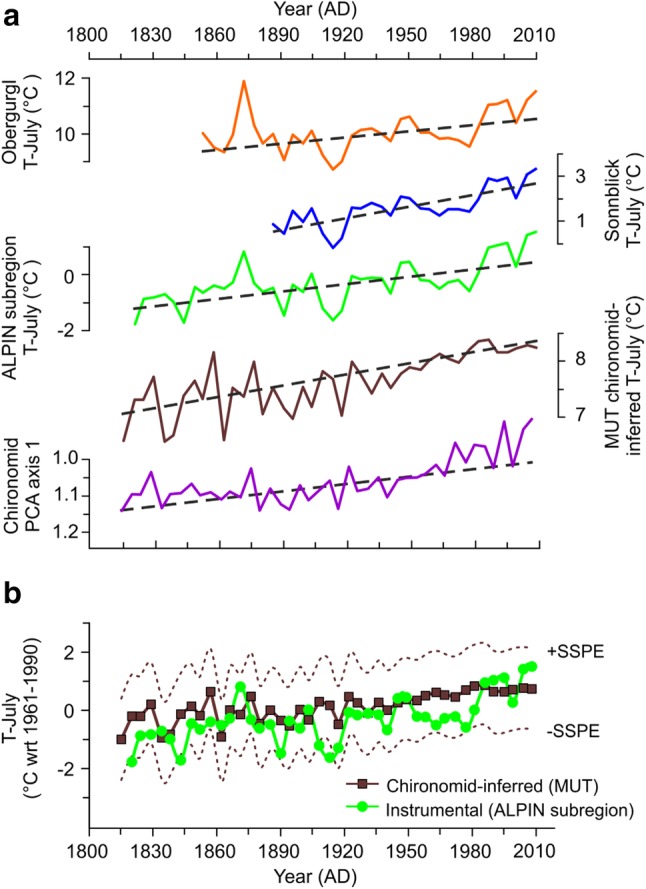
Fig. 6.

a Temperature variations reconstructed at MUT and chironomid PCA axis 1 sample scores compared with 5-years low-pass filtered instrumental temperature records (T-July). All records are plotted at the time resolution of the chironomid samples and together with monotonic trends (dashed lines) calculated using the Kendall–Theil robust line. In order to be comparable, the PCA axis 1 sample scores are plotted along the inverted y axis. b Chironomid-inferred July air temperatures from the MUT record (squares) plotted together with sample-specific prediction errors (SSPEs, dotted lines) compared with the multi-station reconstruction from the ALPIN subregion (circles). The values are anomalies from the 1961–1990 average. All instrumental temperature data are from the HISTALP project database (http://www.zamg.ac.at/histalp/)
