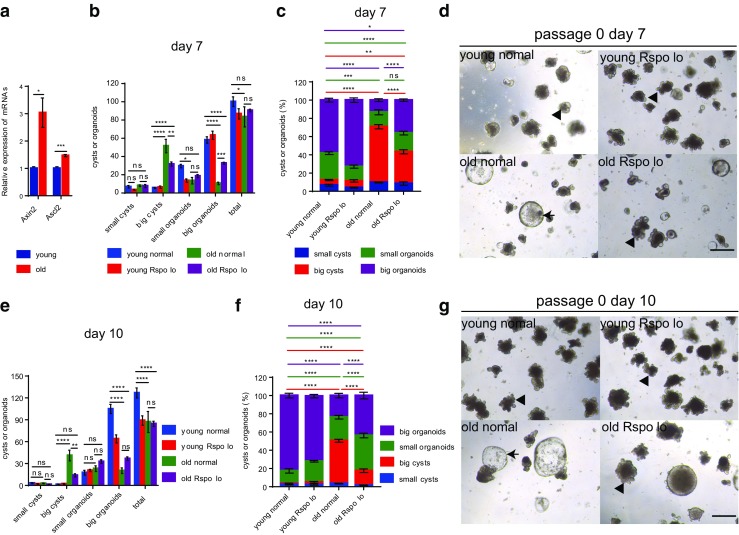
Fig. 3.

Reduction in R-spondin-1 exposure during primary culture ameliorates the aging-induced deficiency in differentiation of ISCs. a mRNA expression of Wnt target genes in crypts derived from 2 months old (young) and 24 months old (old) mice after culturing for 7 days. mRNA expression of genes was normalized to beta-actin with the expression level of each gene in young crypts set to 1 (n = 3 independent experiments). b-g Freshly isolated crypts from 2 months old (young) and 24 months old (old) mice were plated at a density of 200 crypts per well. Concentration of R-spondin-1was reduced to 1/3 of the normal level (330 ng/ml) in half of the wells (results show data from one representative experiment out of 2 independent experiments; n = 3 mice per group). b,c Absolute number (b) and percentage (c) of grown out structures on day 7 after primary plating. d Representative pictures of indicated groups on day 7 after plating. e,f Absolute number (e) and percentage (f) of grown out structures on day 10 after plating. g Representative pictures of indicated groups on day 10 after plating. Young normal: ISCs derived from young mice culturing in normal concentration of R-spondin-1; young Rspo lo: ISCs derived from young mice culturing in 1/3 concentration of R-spondin-1; old normal: ISCs derived from old mice culturing in normal concentration of R-spondin-1; old Rspo lo: ISCs derived from old mice culturing in 1/3 concentration of R-spondin-1;Small cysts: diametres≤70 μm; big cysts: diameters>70 μm; small organoids: with crypt-villus architectures, budding number ≤ 3 (for b and c) and budding number ≤ 5 (for e and f); big organoids: with crypt-villus architectures, budding number > 3 (for b and c) and budding number > 5 (for e and f). Arrow heads indicate typical organoids; arrows indicate typical big cysts. Data are displayed as mean ± SEM. *, P < 0.05; **, P < 0.01; ***, P < 0.001; ****, P < 0.0001. ns, not significant. Unpaired two-tailed Student’s t test was used for a. Two-way ANOVA analysis was used for b,c,e,f. Scale bar: 200 μm
