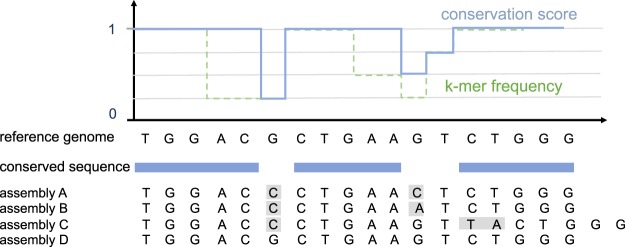
Figure 2.
Illustration of the k-mer frequency method used to select conserved sequences in the reference genome for an example using 3-mers, a hypothetical set of 4 short genome assemblies and a frequency cutoff of 95% (in practice, canonical but longer k-mers are used to favor unique mappings to the genome). The function ‘k-mer frequency’ represents the relative frequency of the reference genome k-mers in the genome assembly set, and the function ‘conservation score’ is generated from this by taking a running maximum in an interval of 3 nucleotides.

