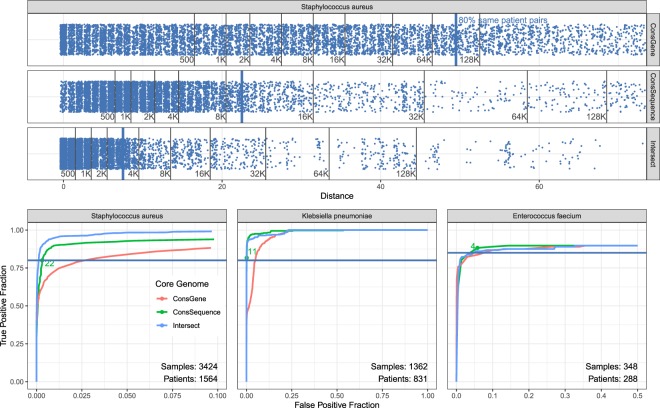
Figure 4.
A comparison of different core genome methods to distinguish same-patient samples from different-patient samples. Top figure shows the SNV distances for same-patient pairs with blue dots. The black lines indicate the cumulative number of different-patient pairs that have SNV distances below the distance indicated on the x axis. The SNV thresholds that capture 80% of same-patient SNV distances correspond to 49 for the conserved-gene, 22 for conserved-sequence and 7 for intersection core genome. Bottom figures show ROC curves for same-patient versus different-patient sample distinction for S. aureus (same data as top panel), K.pneumoniae and E. faecium (selected SNV threshold in green). Note that the x-axis may be truncated for clarity.

