Figure 1.
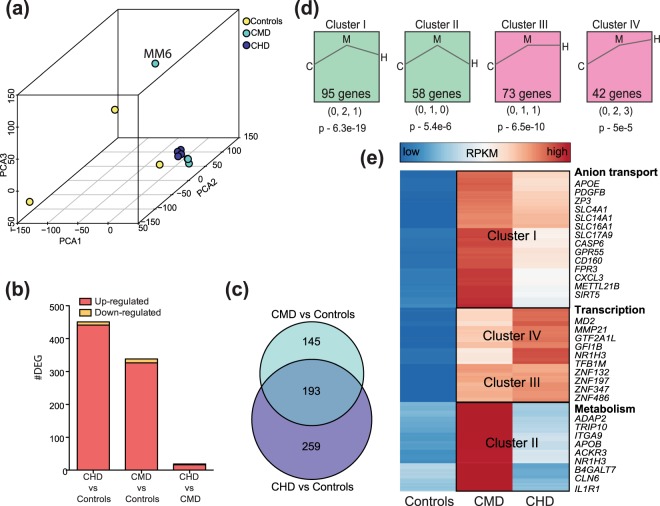
Chronic alcohol drinking alters PBMC gene expression independent of ethanol dose (a) 3D PCA of resting gene expression profiles of PBMC isolated from controls (n = 3), CMD (n = 4), and CHD (n = 4) animals. A potential outlier from CMD is highlighted but was retained in subsequent downstream analyses due to minimal changes in DEG profiles following its removal. (b) Bar graphs denoting number of differentially expressed genes (DEG) (protein coding and miRNA precursor) in CMD and CHD PBMC relative to control PBMC and each other. (c) Venn diagram describing overlap of DEG detected in CHD and CMD animals relative to controls. (d) Clusters of dose-dependent gene expression changes within the 597 genes dysregulated with chronic drinking (CMD and CHD combined) identified using STEM. Only statistically significant clusters (p < 0.05) are shown. Magnitudes of changes in controls (C), CMD (M), and CHD (H) are represented numerically below each representative cluster, with its statistical significance reported by STEM. (e) Heatmap of 268 ethanol sensitive DEG that demonstrated dose-dependent changes in expression (clusters I, II, III, and IV combined). Each row represents a gene with median expression level (RPKM) scaling from low (blue) to high (red). A subset of DEG within each cluster is highlighted.

