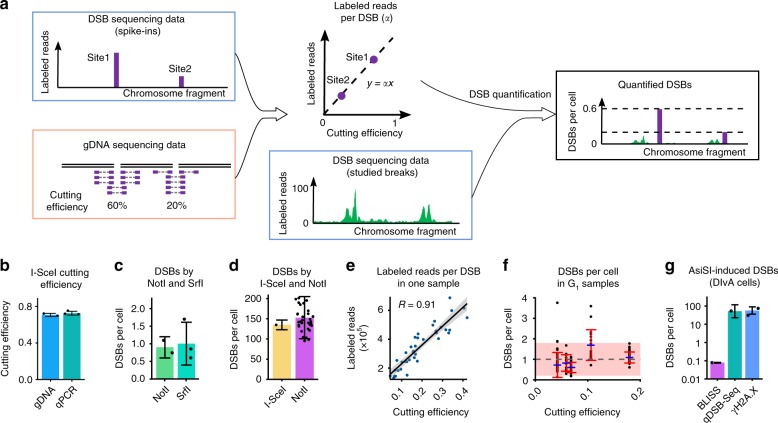
Fig. 2.
qDSB-Seq computation and validation. a Computation of the labeled reads per DSB and DSBs per cell. The ratio of the labeled reads and cutting efficiency at enzyme cutting sites was calculated and then used for DSB quantification in the studied genomic loci. b The estimation of I-SceI cutting efficiency based on gDNA sequencing (n = 2) and qPCR (n = 3). c, d Dependence of qDSB-Seq quantification on the restriction enzyme used. For untreated WT G1-phase cells (c), DSBs were quantified using NotI and SrfI digestion in vitro, two and three biological replicates, respectively. For hydroxyurea (HU)-treated WT S-phase cells (d), DSBs were quantified by I-SceI digestion in vivo (SD was estimated as described in Methods) and NotI digestion in vitro (n = 39, Methods). e Correlation between the number of labeled reads at cutting sites and their cutting efficiencies in an untreated G1-phase sample, digested with NotI enzyme with an average cutting efficiency of 18 %. R: Pearson’s correlation coefficient. The linear regression line with 95% confidence interval is plotted. f DSB numbers in five untreated G1-phase cells. The dashed gray line and the pink-colored area are the mean value (n = 5) and 95% confidence interval, respectively, for all the samples. DSBs per cell values in individual samples are denoted by blue dash, SD are denoted by red intervals (n = 39, 17, 17, 18, 39 from left to right, Methods). g Quantification of AsiSI-induced DSBs in DIvA cells by BLISS (SD, Methods), qDSB-Seq (with BLESS labeling, SD as described in Methods), and counting γH2A.X foci (n = 2), logarithmic scale on the y axis was used. Mean and SD are shown in b and c. DSBs per cell values and SD were calculated as described in Methods in d, f, g. Individual data points are visualized as black dots (b–d, f, g). Source data are provided as a Source Data file

