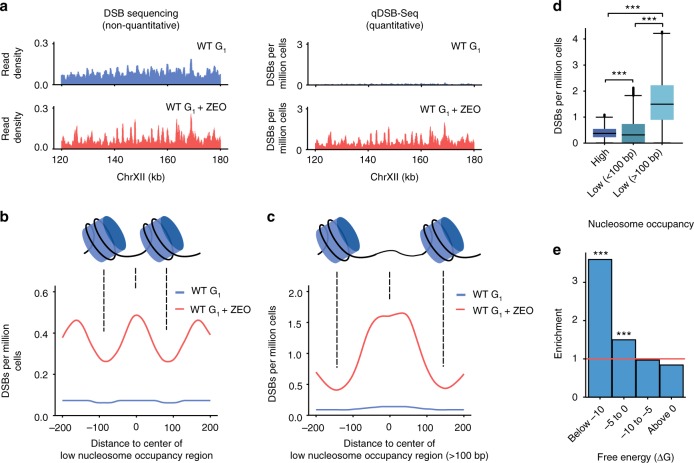
Fig. 3.
Quantification of Zeocin-induced DSBs. a Results of regular DSB sequencing (left, i-BLESS) and quantitative DSB sequencing (right, qDSB-Seq) in a representative fragment of chromosome XII for untreated and Zeocin-treated (ZEO) wild-type (WT) G1-phase cells. For DSB sequencing, read density was normalized to the total number of reads in the sample and thus results do not allow for quantitative comparison between DSBs present in ZEO and G1 samples. For qDSB-Seq, results are quantitative and DSB density within 500 bp sliding window with 50 bp step is shown. b, c Density of Zeocin-induced DSBs in (b) all and (c) ≥100 bp low nucleosome occupancy regions. Nucleosome locations from Lee et al.21 were used; DSB densities, expressed as DSBs per million cells, were calculated in a 50 bp sliding window with a 5 bp step. d Comparison of DSB densities in high nucleosome occupancy regions (High) and low nucleosome occupancy regions (Low). Median (center line), first, and third quartiles (box limits), and 1.5 times the interquartile range (whiskers) are shown. P-values were calculated using two-sided Kolmogorov–Smirnov test, ***P < 0.001. e Enrichment of Zeocin-induced DSBs in regions prone to form very stable DNA secondary structures, as defined by free energy in a 50 bp sliding window as described in Methods. Zeocin-induced DSBs were defined as regions with significant enrichment of DSB-labeled reads in ZEO sample compared with G1-phase control, as identified using Hygestat_BLESS. Enrichment analysis was performed using Hygestat_annotations (Methods); P-values were calculated using the permutation test (Methods); ***P < 0.001. Source data are provided as a Source Data file

