Fig. 4.
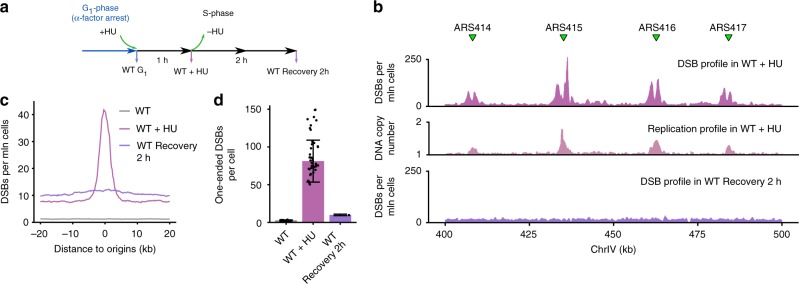
Quantification of replication stress-associated DSBs. a Schematic representation of hydroxyurea (HU) experiments. Cells were arrested in G1-phase with α-factor, treated with HU before release to S-phase, collected after 1 h or resuspended in fresh medium and collected 2 h after removal of HU. b Example of quantified DSB data after 1 h HU treatment and 2 h recovery from HU. Replication origins are marked with green triangles, absolute frequencies of DSBs for a fragment of chromosome IV are shown in a million cells. As a control, replication profile in WT + HU sample (number of gDNA reads in a 500 bp in the sample normalized to untreated G1-phase sample) is shown. c Meta-profile of DSBs around active replication origins under HU treatment, defined as 144 origins with firing time <25 min (early origins, firing time according to Yabuki et al.39). Median of DSB densities, expressed as DSBs per million cells in 2 kb window around each early origin, was calculated and the background was removed as described in Methods. d Quantification of one-ended DSBs. One-ended DSBs per cell values were calculated as described in Methods and SD for WT and WT + HU was calculated using individual NotI cutting sites (n = 39, Methods) and for Recovery 2 h using SD of background noise and assuming Poisson distribution of fragment counts (Methods). Individual data points are visualized as black dots; source data are provided as a Source Data file

