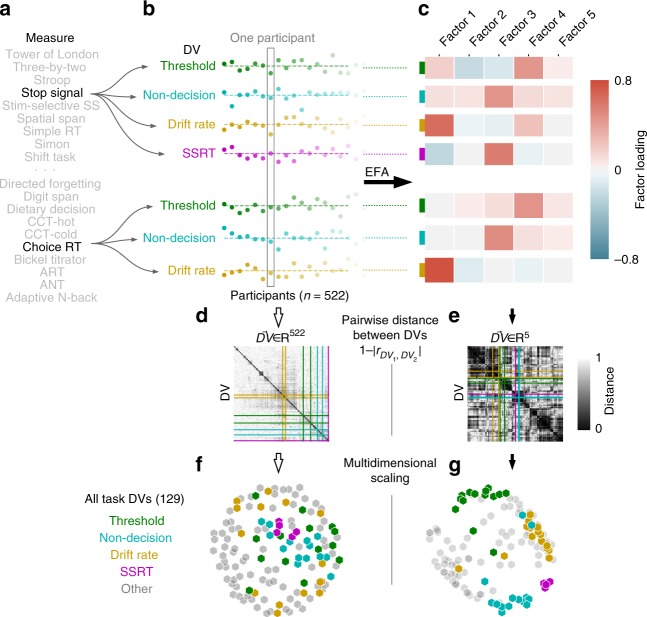
Fig. 1.
Summary of Task Analytic Pipeline. a Participants completed 37 separate task measures, of which a subset are shown. b 1st-level analysis of each measure resulted in a number of DVs. Choice Reaction Time and Stop Signal are shown as two example measures, from which 7 DVs are extracted. Participant scores are displayed as deviations from the mean for each of the 7 DVs. A subset of the 522 total participants are shown as individual dots. c EFA projects each DV from a 522-dimensional participant feature space to a lower-dimensional factor feature space. d, e Pairwise-distance between all 129 task DVs are shown for the participant space (d) and factor space (e). The variables from (b) are indicated by colored lines. f, g DV clusters are revealed in the lower-dimensional EFA space. Multidimensional scaling of the pairwise-distances in EFA space (g, see Methods) highlight obvious clustering, in contrast the participant space (f). DVs are colored based on type for visualization purposes only—actual analysis is wholly unsupervised

