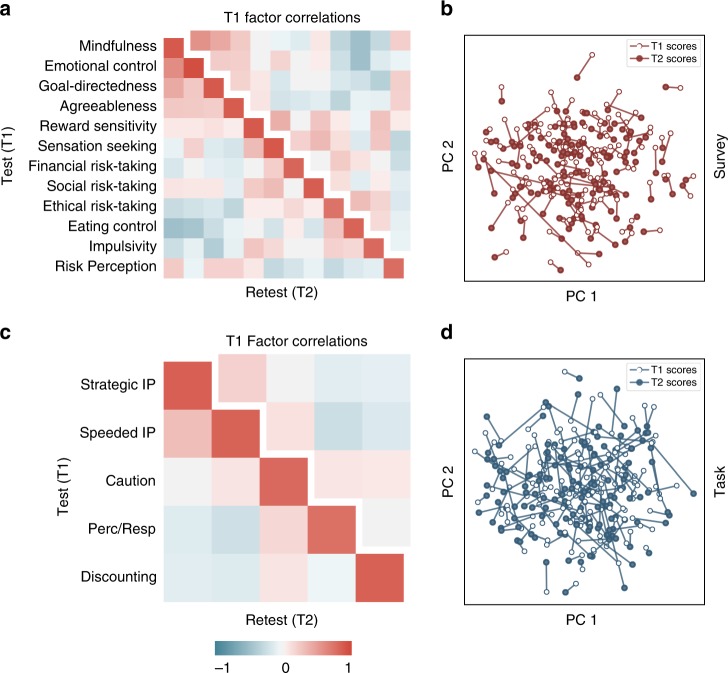
Fig. 5.
Retest reliability and correlations of factor scores. The EFA model derived from the full dataset (n = 522) was applied to a subsample of participants who repeated the entire battery within 4 months (n = 150) to compute factor scores (T2 scores). These factor scores were then correlated with factors scores derived from the same participants during their original testing (T1 scores). The lower triangle and diagonal of the heatmaps reflect these correlations and are displayed for both surveys (a) and tasks (c). The diagonal shows high factor score reliability within-individual across time. The separated upper triangle depicts the factor correlation structure at T1. To visualize the relative stability of individual factor scores compared to group variability, the factor scores were projected into a 2-dimensional space defined using principal components analysis (b, d). T1 scores are depicted using an empty circle and T2 scores are depicted using a filled circle, with each individual corresponding to one stick

