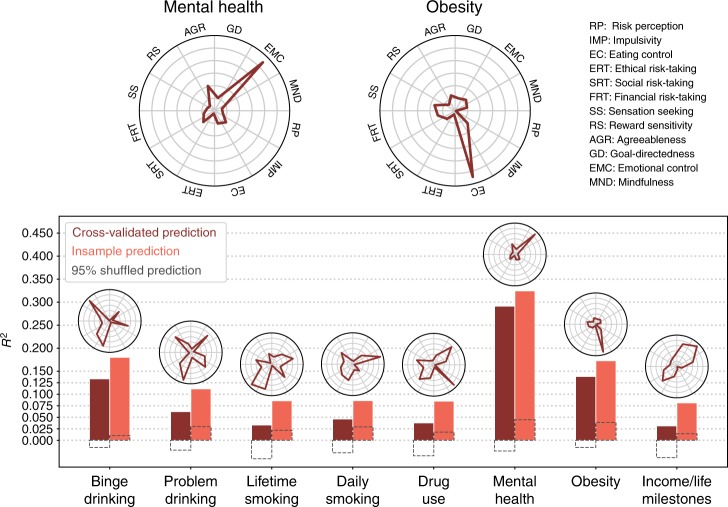
Fig. 6.
Prediction of target outcomes using survey factor scores. Cross-validated (dark bars) and insample (light bars) R2 are shown. Dashed gray boxes indicate 95% of null distribution, estimated from 2500 shuffles of the target outcome. Ontological fingerprints displayed as polar plots indicate the standardized β for each survey factor predicted above chance (randomization test: p < 0.05). The ontological fingerprint for the two best-predicted outcomes are reproduced at the top. The y-axes are scaled for each fingerprint to highlight the distribution of associations—no inference can be drawn comparing individual factor magnitudes across outcomes (see Fig. 8 to do this)

