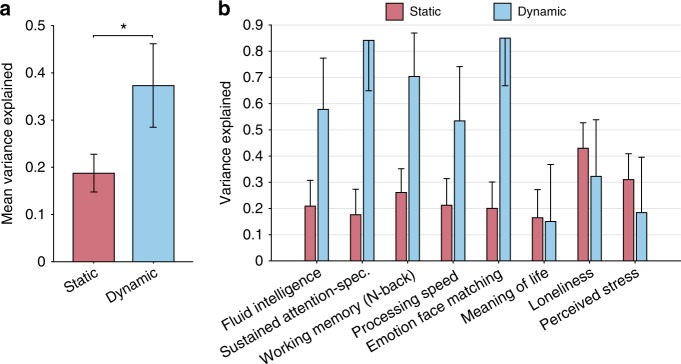
Fig. 1.
Dynamic FC explains more behavioral variance than static FC. a On average over 58 behavioral measures, dynamic FC (blue, 37%) explains more behavioral variance than static FC (red, 19%) (p = 8.31 × 10⁻⁴; two-tailed t-test). b Variance explained for eight representative measures. Here, static FC utilizes Pearson’s correlation, while dynamic FC utilizes the coefficient matrix of a first-order autoregressive model. Error bars indicate standard deviation (SD) of the estimates

