
Figure 1.
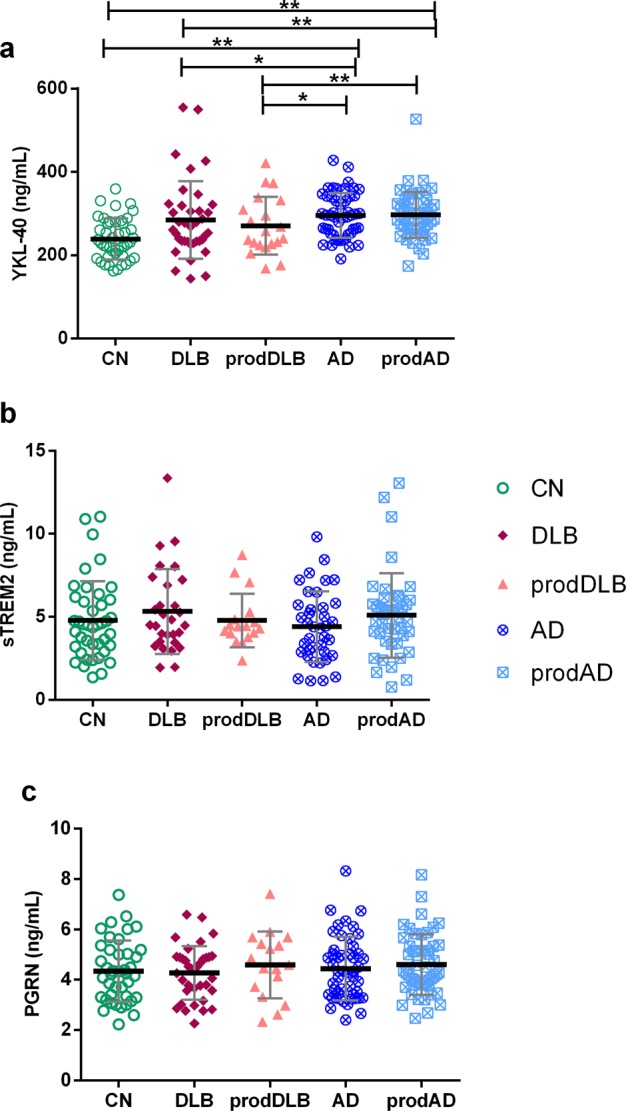
Inflammation-related biomarkers across clinical diagnoses. *p < 0,05, **p < 0.01. The group-wise comparisons were analyzed by ANCOVA adjusting by age for all biomarkers and additionally for sex in the case of sTREM2. The p-values were adjusted by Bonferroni correction for multiple comparisons (10 comparisons). Thicker horizontal bars represent the mean while whiskers represent the standard deviation. CN: cognitively normal controls, DLB: Dementia with Lewy Bodies, prodDLB: prodromal DLB, AD: Alzheimer’s disease, prodAD: prodromal AD. (a) CSF YKL-40 levels in the different clinical groups. (b) CSF sTREM2 levels in the different clinical groups. (c) CSF PGRN levels in the different clinical groups.