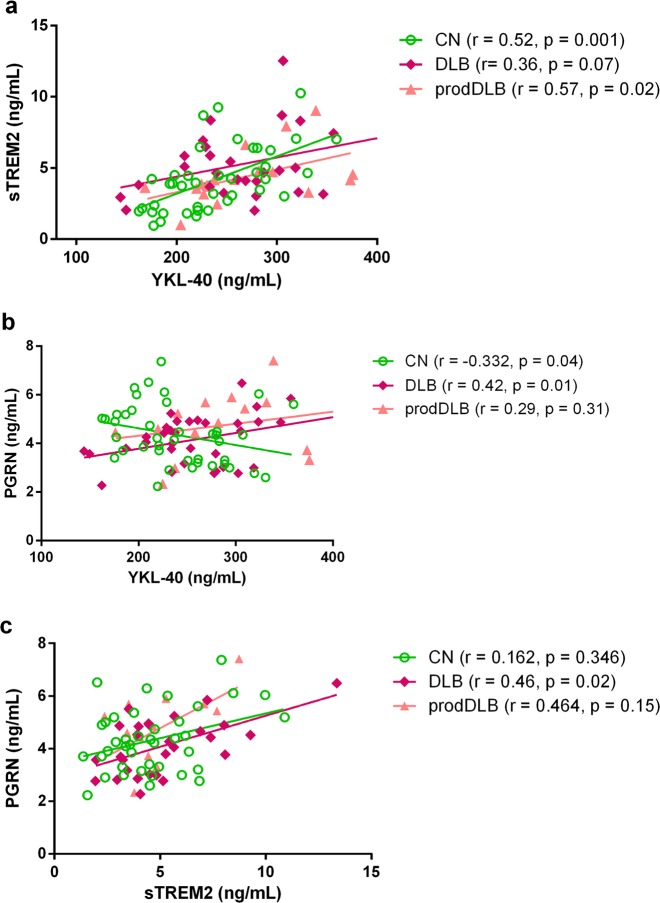
Figure 2.
Correlations between glial biomarkers. CN: cognitively normal controls, DLB: Dementia with Lewy Bodies, prodDLB: prodromal DLB, AD: Alzheimer’s disease, prodAD: prodromal AD. (a–c) Correlations between CSF sTREM2 and YKL-40, PGRN and YKL-40, and sTREM2 and PGRN levels in the different diagnostic groups, r and p-values of the partial correlation are shown in brackets (adjusted by age for all the biomarkers and additionally for sex in sTREM2).

