
Fig. 1.
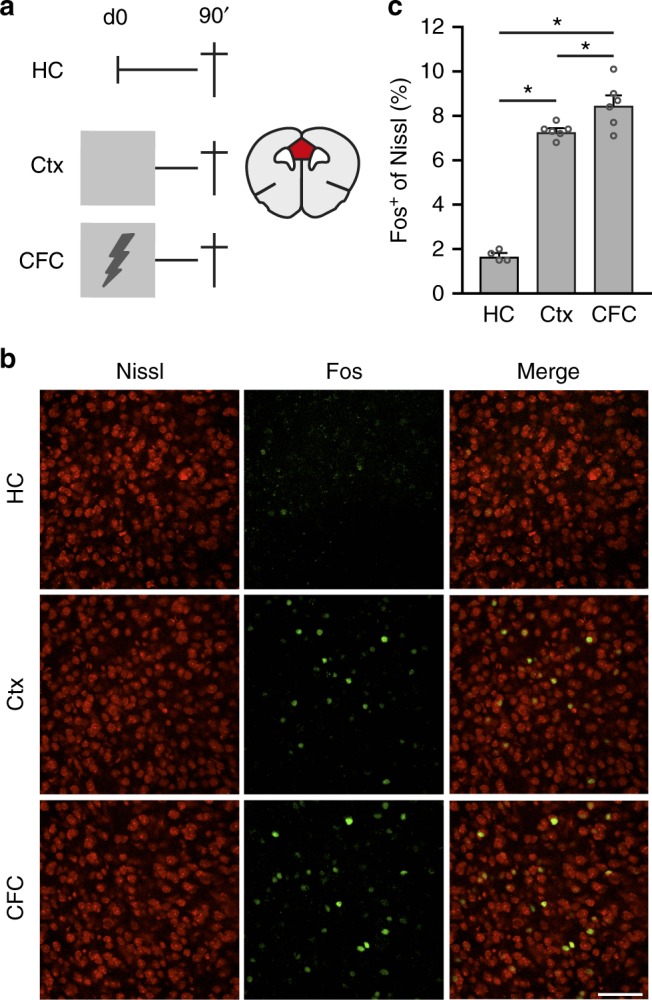
CFC enhanced neuronal activity in the mPFC. a Left: experimental design of groups used to assess Fos expression. Home-cage (HC; n = 4), context exposure only (Ctx; n = 6), contextual fear conditioning (CFC; n = 6). Lightning bold indicates foot-shock (1US). Right: illustration of a coronal brain section indicating the mPFC region (red) where Fos+ neurons were analyzed. b Representative examples of Fos+ cells (green) in all groups. c Percentage of Fos+ cells in each group. One-way ANOVA F(2,13) = 126.3, p < 0.0001. Post-hoc Bonferroni test: HC vs. Ctx *p < 0.0001, HC vs. CFC *p < 0.0001, Ctx vs. CFC *p = 0.032. Scale bar = 50 µm. Bar graph shows mean + s.e.m. Source data are provided as a Source Data file