Fig. 2.
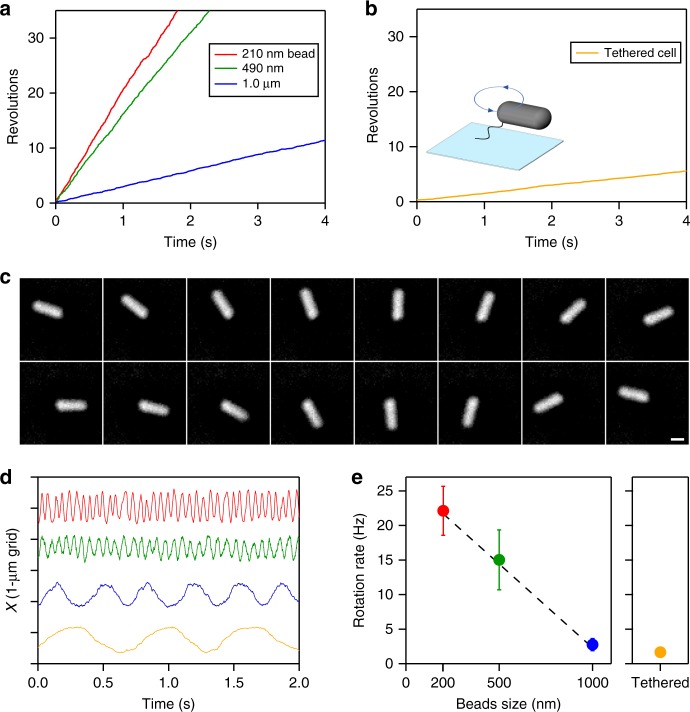
Archaella rotation rate is inversely proportional to load. a Example time courses of rotation of beads of different size. In all figures, red, green, blue, and yellow colors represent 210-nm, 490-nm, 1.0-μm diameter bead, and tethered cell, respectively. b An example time course of cell rotation in a tethered-cell assay. c Sequential phase-contrast micrographs of a tethered cell at 72 ms intervals. Image contrasts have been inverted for clarity. Scale bar, 1 μm. d Time courses of displacements of the center of markers. e Rotation rates of markers of different sizes. Error bars show standard deviations. The sources of data points are shown as values along the axis of ordinate in Fig. 3. Dotted line shows a linear fit, V = A/ϕ + B, where V is rotation rate; ϕ diameter of bead; B = 27 Hz, an intercept; and A = –0.024 Hz nm−1, a proportional coefficient

