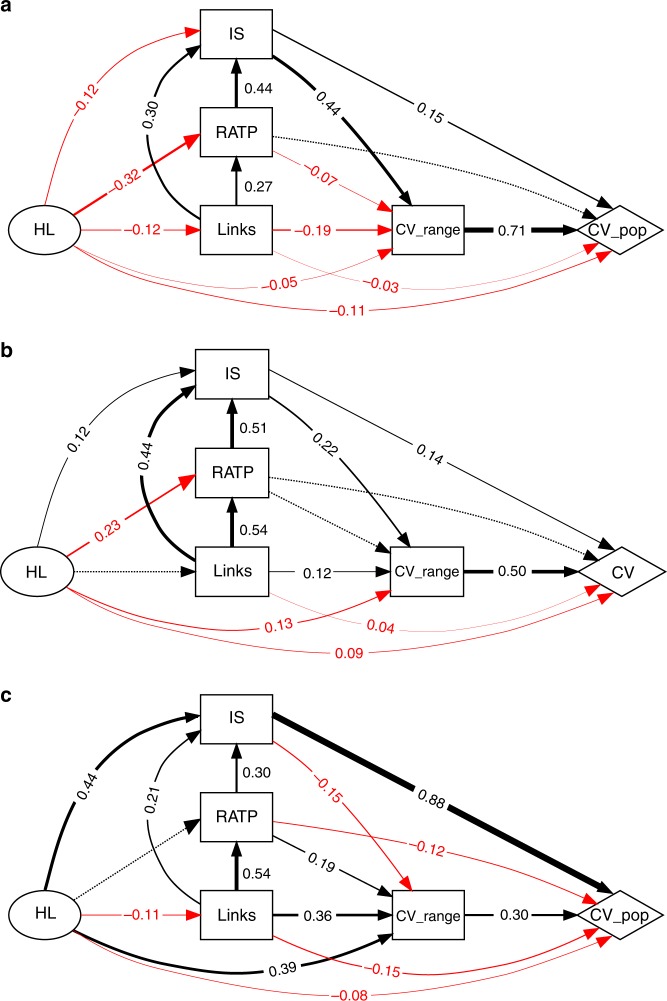
Fig. 4.
Structural equation models (SEMs). SEM diagrams show the pathways that influence stability—temporal variability of population abundances and area variability—of multitrophic communities under different types of HL: a random, b intermediate, and c contiguous. Given the small effect to the fraction of mutualism (Supplementary Note 2), we present aggregate results produced by grouping response data for all fractions of mutualism. This aggregation increases the effective number of replicate simulations. Each arrow indicates a link from a predictor to a response variable. Positive effects are shown in black, negative effects in red. Numbers indicate effect size, given by the magnitude of the range-scaled model coefficients. Width of solid arrows indicates effect size; dashed arrows indicate non-significant links. Multiplication of coefficients along a given path can be interpreted as a measure of the influence along that path relative to other paths in the SEM

