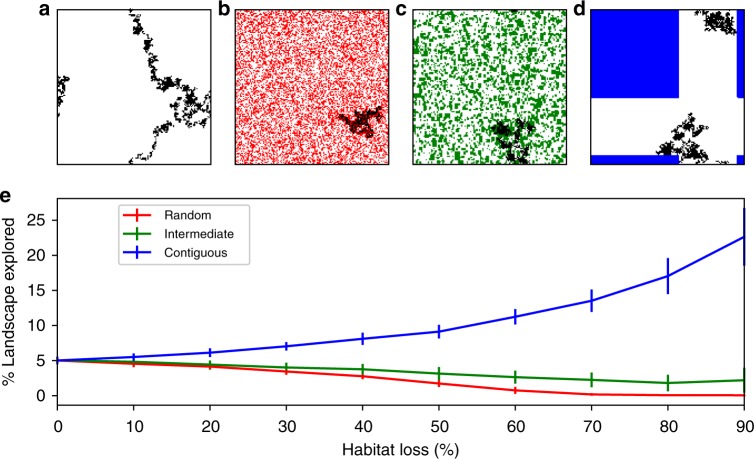
Fig. 5.
Individual movement patterns under different habitat loss types. Top row: example trajectory for a single individual over 5000 time steps in a pristine landscape; b 40% random HL; c 40% intermediate HL; d 40% contiguous HL. Pristine landscape cells shown in white, destroyed cells in red and blue for random and contiguous HL, respectively. Green cells refer to destroyed cells under the intermediate HL scenario. Bottom row e: Fraction of pristine landscape explored by an individual during 5000 time steps. Solid lines indicate mean over 100 repeat runs; error bars indicate ±1 standard deviation

