Figure 4.
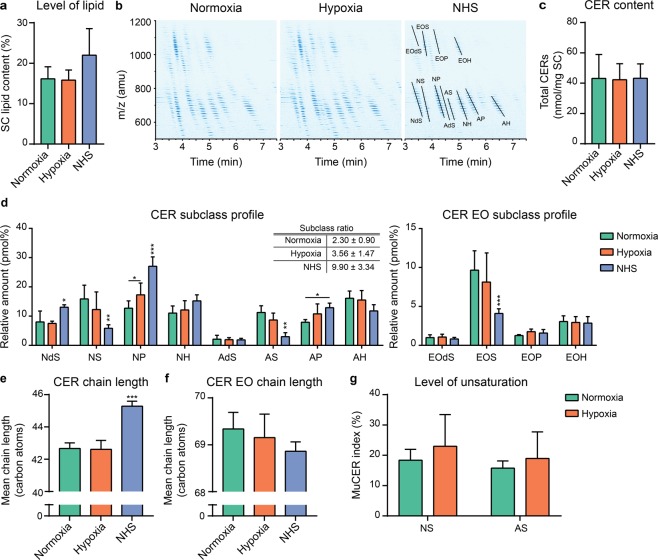
Stratum corneum ceramide composition of FTMs generated under hypoxia. (a) Level of total lipids in the SC of FTMs generated at indicated oxygen level and NHS. (b) Ion maps as detected by LC-MS of FTMs generated under normoxia or hypoxia and NHS. Twelve CERstotal subclasses are identified. (c) Cumulative amount of quantified CERstotal per mg SC in FTMs and NHS. (d) CER and CER EO subclass profile of FTMs and NHS. Tabular inset provides subclass ratio defined by , as mean ± s.d. (e) Bar diagram plot compares the CER mean chain length in FTMs and NHS. (f) Bar diagram plot compares the CER EO mean chain length in FTMs and NHS. (g) Level of unsaturation in CER subclasses NS and AS in FTMs. All data represents mean + s.d. Significance is shown for comparison between normoxia and hypoxia (with lines) and for comparison between FTMs and NHS (above NHS), otherwise indicated. Statistical differences are noted as *, ** or ***, corresponding to P < 0.05, <0.01, <0.001.

