Figure 5.
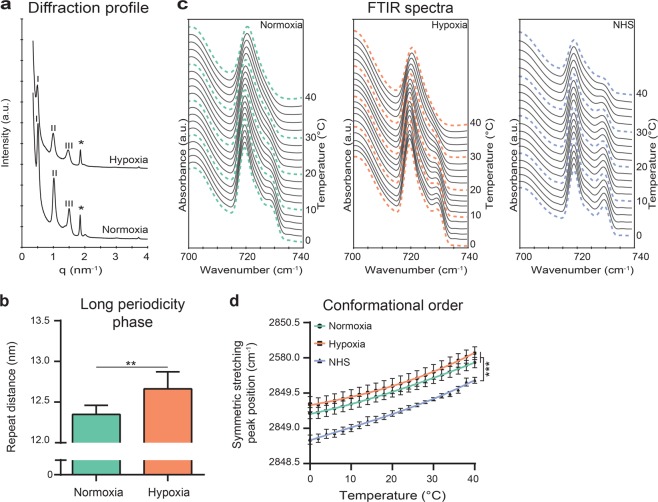
Lipid organization in FTMs generated under hypoxia. (a) Small angle X-ray diffraction profiles of FTMs developed under normoxia and hypoxia. Orders of diffraction of the LPP are indicated by roman numbers and phase separated crystalline cholesterol is indicated by the asterisk (*). (b) Bar diagram plot of the long periodicity phase repeat distances in both FTMs. Data represent mean + s.d. Statistical testing is performed by paired t-test. (c) Representative rocking vibrations in a temperature range of 0–40 °C in FTMs developed under normoxia, hypoxia and of NHS. (d) Conformational ordering of the lipids based on the symmetric stretching peak position over a temperature range of 0–40 °C. Third order polynomial regression line connects the data points. Data represents mean ± s.e.m., n = 4.

