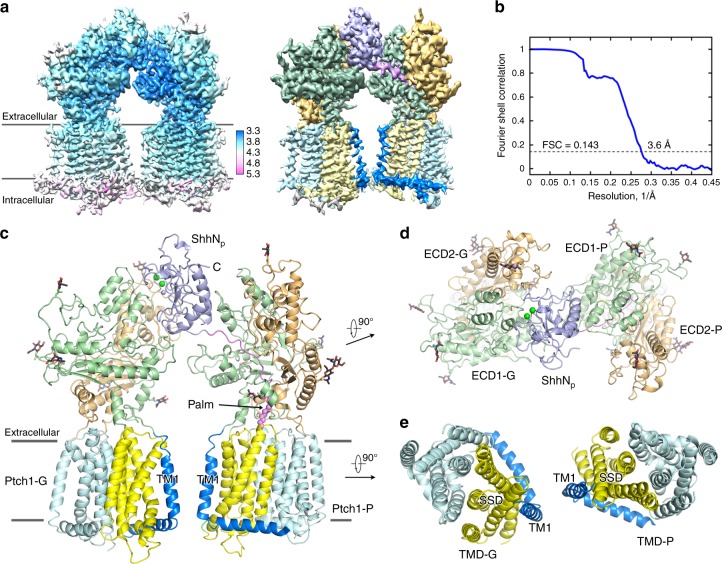
Fig. 2.
Structure of the 2:1 Ptch1–ShhNp complex. a Cryo-EM map for the 2:1 Ptch1–ShhNp complex. Higher resolution was achieved after applying adapted mask to dimeric Ptch1 with one ShhNp. Left panel: local resolution map calculated using RELION 2.0. Right panel: domain-colored map with the same color code for our previous report19. b The gold-standard Fourier shell correlation curve for the cryo-EM map. c Overall structure of one ShhNp bound to two Ptch1. To facilitate illustration, we named the two Ptch1 protomers as Ptch1-G (G for globular) and Ptch1-P (P for palmitoylate and peptide). The N-terminal palmitoyl moiety is highlighted as violet sphere. The Ca2+ and Zn2+ ions are shown as green and purple spheres, respectively. The glycosyl moieties are shown as black sticks. d ECDs and ShhNp viewed from extracellular view. e Transmembrane domains are shown in the extracellular view. All structure figures were prepared in PyMol62

