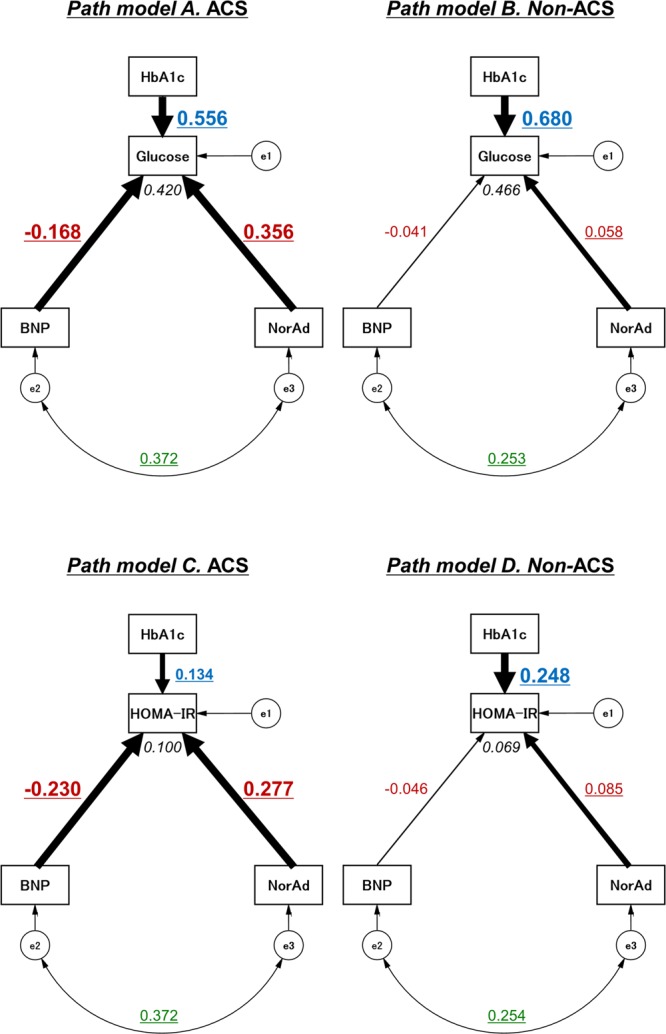
Figure 1.

Path diagrams against plasma glucose levels and HOMA-IR levels. Path models theoretically proposed to clarify the contribution of BNP and noradrenaline to glucose as well as to HOMA-IR levels in ACS subjects (n = 216) (Path model A and C, respectively) and in non-ACS subjects (n = 856) (Path model B and D, respectively). Each path has a coefficient showing the standardized coefficient of a regressing independent variable on a dependent variable of the relevant path. These variables indicate standardized regression coefficients (direct effect) [underlined portions indicate remarkable values], squared multiple correlations [narrow italics] and correlations among exogenous variables [green]. ACS = acute coronary syndrome; BNP = B-type natriuretic peptide; e = extraneous variable; HbA1c = hemoglobin A1c; HOMA-IR, homeostasis model assessment of insulin resistance; NorAd = noradrenaline.
