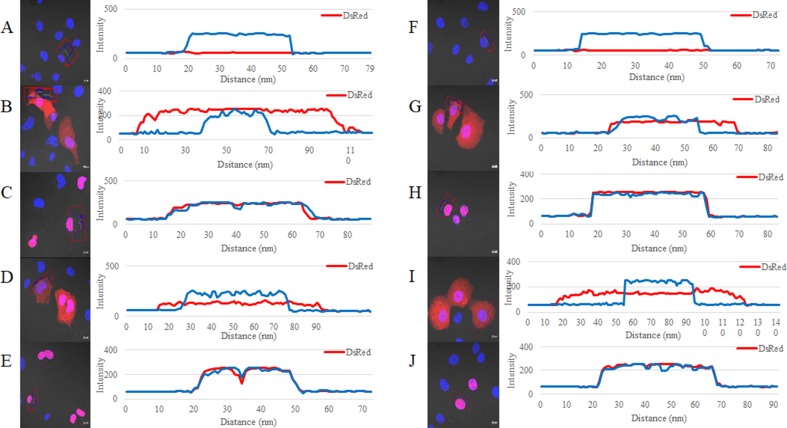
Fig. 3.
Fluorescence density analysis. Vectors transfected in COS1 (a–e) and COS7 (f–j) cells. a Control b pDsRed2-C1-wt (Clontech) c pDsRed2-C1-1NLS d pDsRed2-C1-S100A10-wt e pDsRed2-C1-S100A10-1NLS f control g pDsRed2-C1-wt (Clontech) h pDsRed2-C1-1NLS i pDsRed2-C1-S100A10-wt j pDsRed2-C1-S100A10-1NLS. Blue line represents the fluorescence intensity in the nucleus and red represents the fluorescence intensity of DsRed. Controls (a) and (f) correspond to non-treated COS1 and COS7 cells

