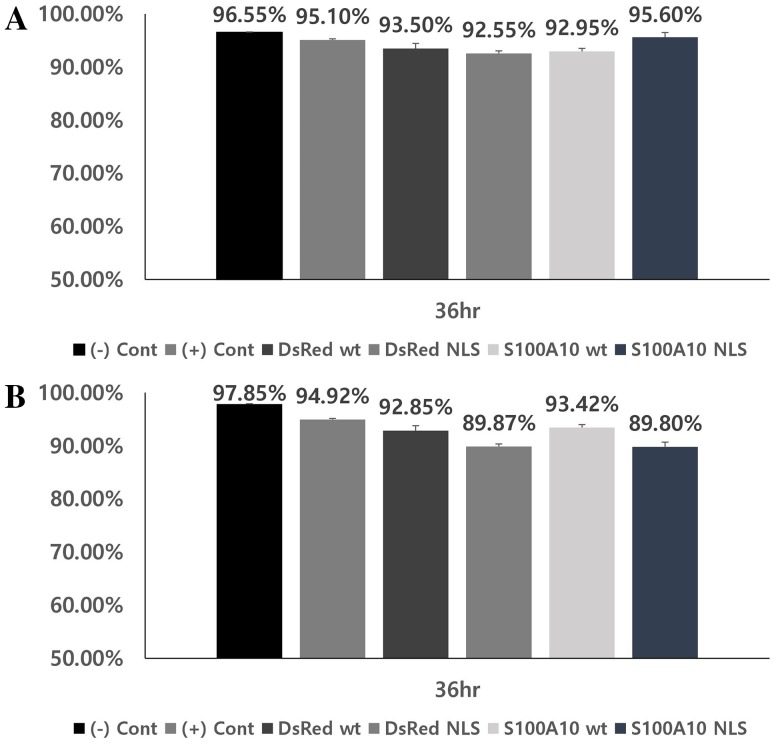
Fig. 5.
Cell viability in cells transfected with vectors. Cell viability of transfected vectors in a COS1 and b COS7 cells. Values are presented as the mean ± SEM (n = 3) and expressed as percentage decrease in cell viability. (−) Controls correspond to non-treated COS1 and COS7 cells. ( + ) Controls correspond to COS1 and COS7 cells treated only with transfection reagents

