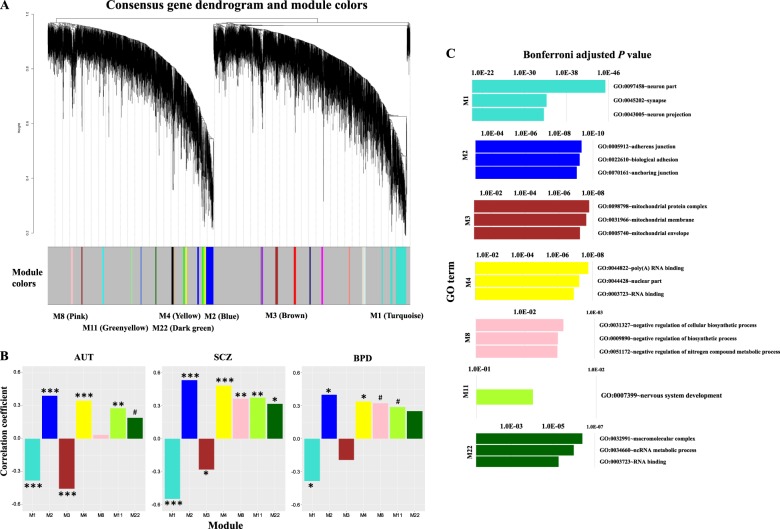
Fig. 3.
a The clustering tree (dendrogram) of genes and the identified consensus modules. The mentioned modules (M1, M2, M3, M4, M8, M11 and M22) in the main text are marked. For these modules, b shows the correlation between module eigengenes and disease status. FDR-corrected P < 0.001(***); <0.01 (**); <0.05 (*); <0.1 (#). c The top three significant GO terms enriched in responding modules are shown with Bonferroni adjusted P-values

