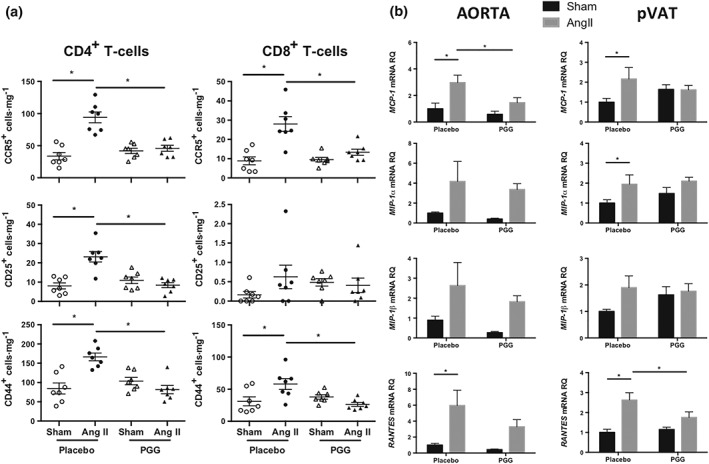
Figure 3.

Effect of 1,2,3,4,6‐penta‐O‐galloyl‐β‐d‐glucose (PGG) on T‐cell infiltration in perivascular adipose tissue (pVAT) and the expression of selected genes in aorta and pVAT in Ang II‐dependent hypertension. (a) Absolute number of CD4+ and CD8+ T‐cells bearing CCR5, CD25, and CD44 in pVAT expressed as cells·mg−1 of tissue (n = 7 each). (b) Expression of MCP‐1 (CCL2), MIP‐1α (CCL3), MIP‐1β (CCL4), and RANTES (CCL5) in aorta and pVAT of sham and Ang II groups treated with PGG or placebo (n = 5 for sham and n = 6 for Ang II). *P < 0.05
