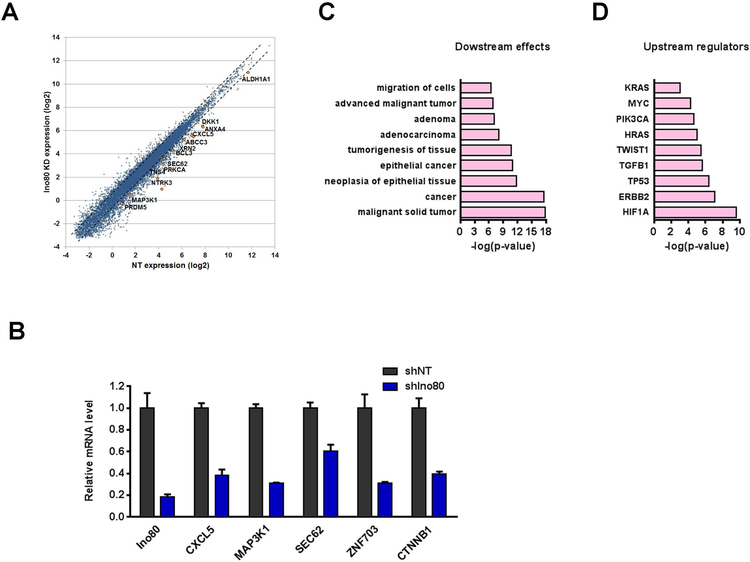
Figure 4. INO80 promotes the expression of lung cancer-associated genes.
(A) Scatter plot showing the differentially expressed genes (DEGs) after Ino80 silencing. A549 cells were infected with NT or Ino80-shRNA viruses, and gene expression changes were determined by RNA-seq 4 days after virus infection. (B) RT-qPCR showing the down-regulation of genes important in lung cancer after Ino80 silencing. Gene expression was normalized to β-actin, and values were plotted as Mean ± SEM. (C) IPA showing the enrichment of cancer-associated genes in the down-regulated genes upon Ino80 silencing. Selected top categories are shown, and please see table S3 for the complete list. (D) IPA showing the predicted upstream regulators based on the down-regulated genes upon Ino80 silencing.

