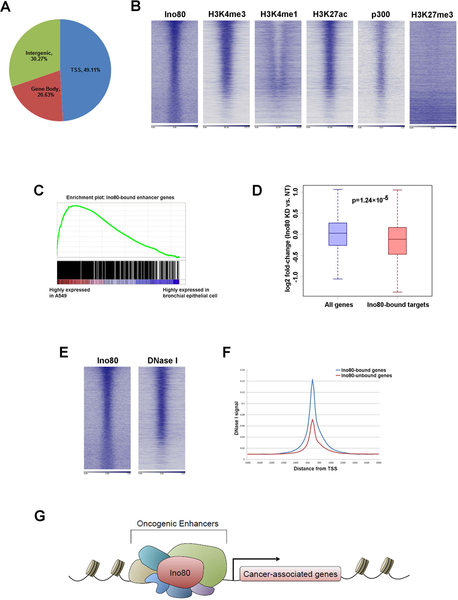
Figure 6. INO80 occupies enhancers near lung cancer-associated genes and activates oncogenic transcription.
(A) Ino80 peak distribution in the genome. (B) Heat maps showing Ino80, H3K4me3, H3K4me1, H3K27ac, p300 and H3K27me3 occupancy in A549 cells. Genes were sorted based on Ino80 peak FDR. (C) GSEA showing that the Ino80-bound enhancer genes are enriched for those that are highly expressed in A549 vs. normal branchial epithelial cells. (D) Box plot showing that Ino80 silencing results in down-regulation of Ino80-bound lung cancer-associated genes. (E) Heat maps showing Ino80 occupancy and DNase I hypersensitive sites in A549 cells. Genes were sorted based on Ino80 peak FDR. (F) DNase I hypersensitivity at genes bound or not bound by Ino80. (G) Proposed model for INO80 in lung cancer: INO80 occupies enhancers near lung cancer-associated genes and promotes oncogenic transcription.

